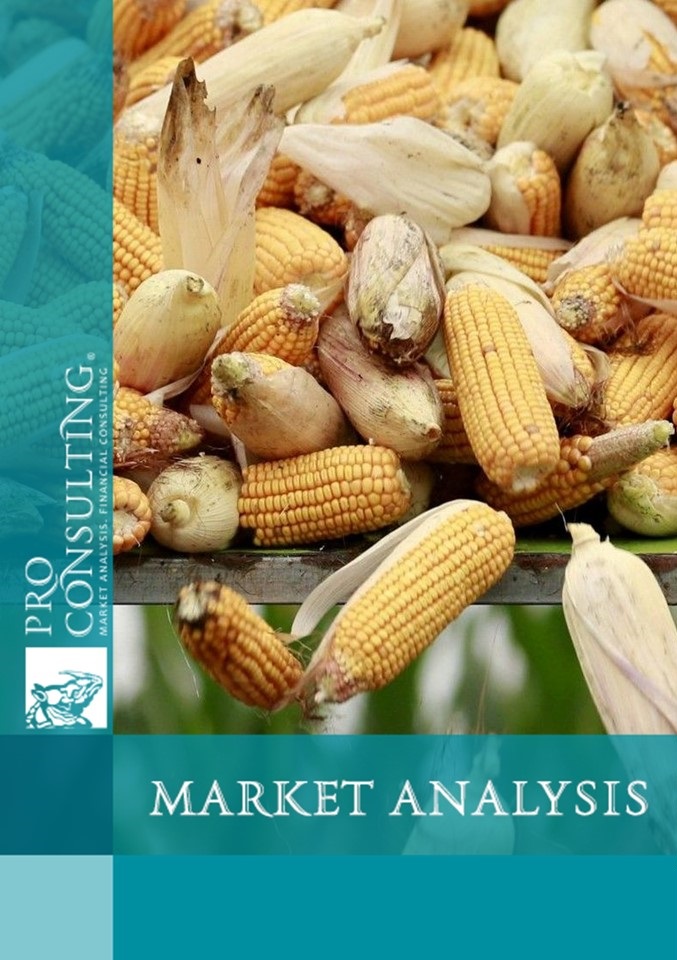
Market research report on corn processing in Ukraine. 2020 year
| Date of Preparation: | October 2020 year |
| Number of pages: | 34, Arial, 1 interval, 10 pt |
| Graphs and charts: | 15 |
| Tables: | 32 |
| Payment method: | prepayment |
| Production method: | e-mail or courier electronically or in printed form |
| Report language: | ukrainian, russian, english |
- This report can be updated and customized based on your business goals; you can also purchase part of report (no less than 50%) at a more affordable price
- Failed to find your market research report? - contact us
- You can also order feasibility study and business plan for your business idea


Detailed contents:
1. General characteristics of the market for sugar and corn by-products
1.1. Analysis of trends in the development of the corn processing market (factors of influence on the market, development problems, dependence on regional characteristics) - by products by region.
1.2. General market indicators, calculation of consumption of corn by-products by groups
1.3. Market segmentation (structure by regions, by product segments)
2. State regulation. Existence of legislation regulating the consumption of certain processed products. Import and export duties
3. Dynamics of production of corn by-products by groups
4. Main producers of processed products
4.1. List of main market operators and their description
4.2. Structuring of operators (by product segments, regions and countries)
4.3. Market shares of the main market operators (estimated by the level of world production)
4.4. Features of competition and risks
5. Foreign trade
5.1. Export of processed products in 2018 - 1st half. 2020 (volumes, structure by goods, geographical structure; structure by exporters)
5.2. Imports of processed products in 2018 - 1st half. 2020 (volumes, structure by goods, geographical structure; structure by importers)
6. Price and market pricing
- Exchange prices for corn
- Export and import prices for processed products (broken down by subspecies and operators)
7. Consumption in the market
7.1. Preferences for corn processed products in comparison with substitute products
7.2. The largest consumer industries of corn products (general description and development of industries in the world as a whole to determine the potential)
7.3. List of buyers, industry affiliation and export volumes of corn products
8. Conclusions and forecasts of development in the market
8.1. Conclusions and Forecast Market Development Trends
8.2. Construction of market development hypotheses. Forecast indicators of market development in 2020 - 2024
8.3. Recommendations for development in the market for a Ukrainian export-oriented company (by goods)
9. Investment attractiveness of the industry
9.1. SWOT analysis of the market direction
9.2. PEST-analysis of factors of influence on the market
9.3. Existing risks and barriers to market entry. Building a risk map in the market
List of Tables:
1. General characteristics of the market for sugar and corn by-products
1.1. Analysis of trends in the development of the corn processing market (factors of influence on the market, development problems, dependence on regional characteristics) - by products in the context of regions.
1.2. General market indicators, calculation of consumption of corn processed products by groups
1.3. Market segmentation (structure by regions, by product segments)
2. State regulation. Availability of legislation regulating the consumption of certain processed products. Import and export duties
3. Dynamics of production of processed corn products by groups
4. Major manufacturers of processed products
4.1. List of main market operators and their description
4.2. Structuring of operators (by product segments, regions and countries)
4.3. Market shares of the main market operators (estimated by the level of world production)
4.4. Features of competition and risks
5. Foreign trade
5.1. Exports of processed products in 2018 - 1st half 2020 (volumes, structure by goods, geographic structure; structure by exporters)
5.2. Imports of processed products in 2018 - 1st half 2020 (volumes, structure by goods, geographic structure; structure by importers)
6. Price and pricing in the market
- Exchange prices for corn
- Export and import prices for processed products (broken down by subspecies and operators)
7. Market consumption
7.1. Preferences for processed corn products versus substitute products
7.2. The largest industries consuming corn products (general description and development of industries in the world as a whole to determine the potential)
7.3. List of buyers, industry affiliation and export volumes of corn processed products
8. Conclusions and forecasts of development in the market
8.1. Conclusions and forecast trends in market development
8.2. Constructing hypotheses of market development. Forecast indicators of market development in 2020 - 2024
8.3. Recommendations for development in the market for a Ukrainian export-oriented company (by goods)
9. Investment attractiveness of the industry
9.1. Market direction SWOT analysis
9.2. PEST analysis of market influencers
9.3. Existing risks and barriers to market entry. Building a risk map in the market
List of graphs and charts:
1. Dynamics of production of corn by-products by groups
2. Deliveries of corn from regions in 2018 and distribution of enterprises
3. Deliveries of corn from regions in 2019 and distribution of enterprises
4. Deliveries of corn from regions in 2020 and distribution of enterprises
5. Structure of exports of corn products from Ukraine in 2018
6. The structure of exports of corn products from Ukraine in 2019
7. Structure of imports of corn products in 2018
8. Structure of imports of corn products in 2019
9. Structure of imports of corn processed products in the 1st half. 2020
10. Exchange price for corn (futures) in 2018 - 1 half. 2020 (per month)
11. Forecast indicators of the market capacity of glucose and glucose syrups in 2020-2024, in physical terms, tons
12. Forecast indicators of the market capacity of corn gluten in 2020-2024, in physical terms, tons
13. Forecast indicators of the market capacity of corn starch and glucose syrups in 2020-2024, in kind, tons
14. Forecast indicators of fructose market capacity in 2020-2024, in physical terms, tons
15. Forecast indicators of corn oil market capacity in 2020-2024, in physical terms, tons
