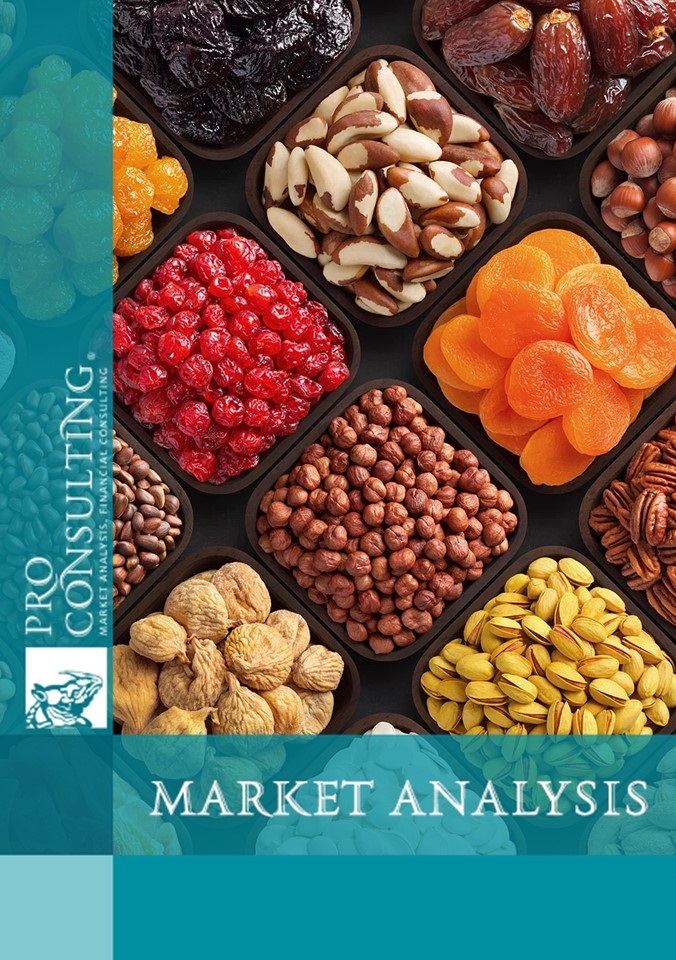
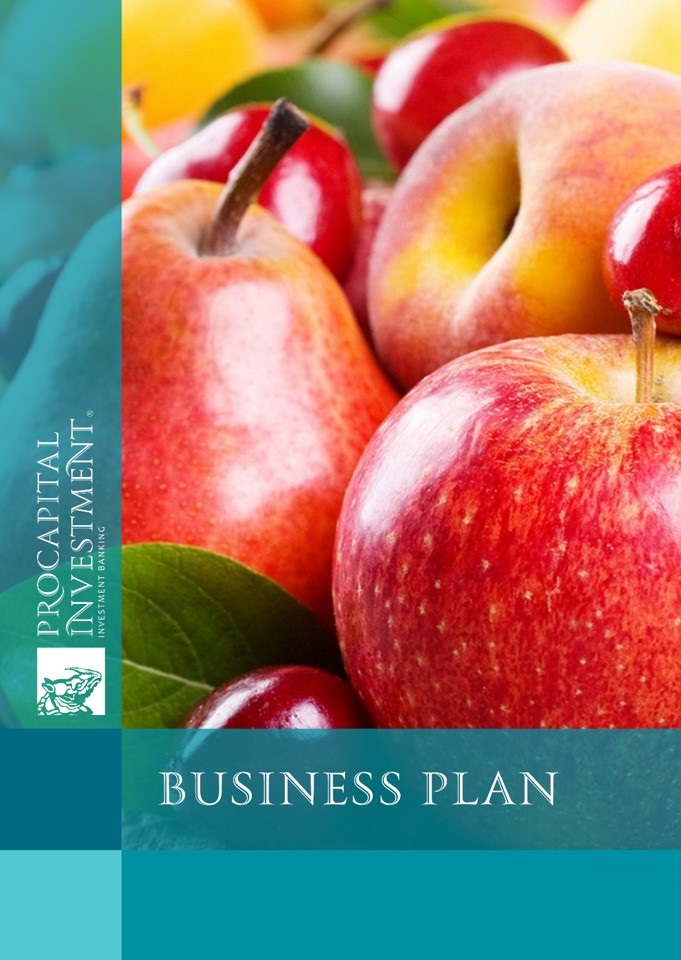
Market research report on fruits and nuts in Azerbaijan, countries of the Caspian-Black Sea region and globally. 2022 year
| Date of Preparation: | June 2022 year |
| Number of pages: | 236, Arial, 1 interval, 10 pt |
| Graphs and charts: | 89 |
| Tables: | 144 |
| Payment method: | prepayment |
| Production method: | e-mail or courier electronically or in printed form |
| Report language: | ukrainian, russian, english |
- This report can be updated and customized based on your business goals; you can also purchase part of report (no less than 50%) at a more affordable price
- Failed to find your market research report? - contact us
- You can also order feasibility study and business plan for your business idea


Detailed contents:
1. General characteristics of the market by levels (national, regional, global)
1.1. Description of the market (list of researched products. Most common processing methods (“Map of application”), regional boundaries. Climatic conditions for growing individual fruits in different regions (identification of competing countries)
1.2. Analysis of market development trends by levels
1.3. General market indicators in 2017-2021
1.3.1. Market capacity of the studied fruits by levels and regions
1.3.2. Cultivation areas of the studied fruits and nuts
1.3.3. Fruit yield in different countries (cultivation efficiency)
1.4. Market segmentation and structuring
1.4.1. Structure of consumption of studied fruits and nuts by types
1.4.2. Consumption structure by region
2. State regulation of the industry
2.1. International product requirements (content assumptions, processing, etc.)
2.2. Main taxes by country, tax incentives for local agricultural enterprises
3. Dynamics of cultivation of the studied fruits by countries and levels in 2017-2021
4. Main market operators (enterprises engaged in cultivation)
4.1. List of the main market operations and their characteristics
4.2. Company volumes (space / revenue)
4.3. Analysis of market forces by levels and associated risks
5. Foreign trade in the market of the studied fruits (Azerbaijan; all countries of the Caspian-Black Sea region; For the global market - the largest producing and consuming countries)
5.1. Fruit export in 2017-2021
- overall trends and exports structure (by country)
- exports volumes, geography and prices (by product type)
5.2. Fruit imports by species in 2017-2021
- overall tendencies and imports structure (by country)
- exports volumes, geography and prices (by product type)
6. The range of products presented on the market (analysis of the width of the range in the context of products and countries)
6.1. Availability of fruits and nuts in online stores of the studied countries and regions
6.2. Drying products, freezing
6.3. Juices and jams
6.4. Other products.
7. Price and market pricing
7.1 Average current fruit and nut prices
7.1.1 Export and import prices
7.1.2. Retail prices
8. Branding and advertising (analysis of the positioning of competitors in the market, presence in promotion channels) - selection of companies that are close in profile to the Customer, which are most actively engaged in promoting their brand and analyzing activities.
9.Analysis of the consumption of the studied fruits on the market
9.1. Structuring per capita consumption by country by type of crop
9.2. Search for local consumption patterns (popular products in different countries)
9.3. Structuring and segmentation of consumption by types of consumers in the B2C segment (based on secondary data)
9.4. Segmentation and state of consumer sectors of fresh, frozen and dried fruits and nuts in the B2B segment (based on secondary data)
9.4.1. Producers of processed products (canning factories)
9.4.2. Confectionery industry
9.4.3. Other companies
9.5. The need for a product / service (comparison of demand for fruits in different countries, identification of potential points of growth for the Customer)
10. Marketing channels for fruits and nuts (description and assessment of the sales structure by channels by country
11. Conclusions. Forecast indicators
11.1. Conclusions and forecast Market trends
11.1.1. Macroeconomic environment and its potential impact on consumption in the market
11.1.2. Local factors that will stimulate consumption, special properties of individual products that will contribute to trends
11.2. Construction of the theory of market development. Forecast indicators of consumption of fruits and fruits by detection, observed and world level (forecast for each level with reasoning and a multifactorial calculation model) for 2022-2030.
11.3. Recommendations for development in the market
11.3.1. At the national level - in terms of promoting the company's brand, expanding the product portfolio, new distribution channels.
11.3.2. For the regional and global level - in terms of new countries for the marketing of selected products
12. Investment attractiveness of the industry
12.1. SWOT analysis of company in the market (relative to national and regional levels)
12.2. PESTLE-analysis of factors influencing the market.
12.3. Existing risks and barriers to market entry. Building a risk map for a work strategy as recommended in section
List of Tables:
1. Segmentation of the fruits and nuts market by processing methods
2. Climatic conditions for growing fruits and nuts
3. Armenia, market capacity, thousand tons
4. Azerbaijan, market capacity, thousand tons
5. Georgia, market capacity, thousand tons
6. Iran, market capacity, thousand tons
7. Kazakhstan, market capacity, thousand tons
8. Russian Federation, market capacity, thousand tons
9. Turkey, market capacity, thousand tons
10. Turkmenistan, market capacity, thousand tons
11. Area harvested almonds, with shell, by global regions, ha
12. Area harvested hazelnuts, with shell, by global regions, ha
13. Area harvested apples by global regions, ha
14. Area harvested peaches and nectarines by global regions, ha
15. Area harvested pears by global regions, ha
16. Area harvested apricots by global regions, ha
17. Area harvested plums and sloes by global regions, ha
18. Area harvested cherries by global regions, ha
19. Area harvested quinces by global regions, ha
20. Area harvested persimmons by global regions, ha
21. Area harvested almonds, with shell, regional level, ha
22. Area harvested hazelnuts, with shell, regional level, ha
23. Area harvested apples, regional level, ha
24. Area harvested peaches and nectarines, regional level, ha
25. Area harvested peaches and nectarines, regional level, ha
26. Area harvested apricots, regional level, ha
27. Area harvested plums and sloes, regional level, ha
28. Area harvested cherries, regional level, ha
29. Area harvested quinces, regional level, ha
30. Area harvested persimmons, regional level, ha
31. Fruit yield in the countries under study in 2020, t/ha
32. Recommended temperature for some fruits
33. Systems of taxation of agricultural producers in the states of Armenia, Russia, Kazakhstan.
34. Income tax in Turkey from 2020
35. The tax field of agriculture in some countries
36. Import tariffs in EU for Azerbaijan
37. Dynamics of growing almonds in the context of world regions, 2017-2021, thousand tons
38. Dynamics of growing hazelnuts by regions of the world, 2017-2021, thousand tons
39. Dynamics of apple cultivation by regions of Europe, 2017-2021, thousand tons
40. Dynamics of growing peaches and nectarines in the context of world regions, 2017-2021, thousand tons
41. Dynamics of pear cultivation by world regions, 2017-2021, thousand tons
42. Dynamics of apricot cultivation in the context of world regions, 2017-2021, thousand tons
43. Dynamics of plum and blackthorn cultivation by world regions, 2017-2021, thousand tons
44. Dynamics of cherry cultivation by world regions, 2017-2021, thousand tons
45. Dynamics of quince cultivation by world regions, 2017-2021, thousand tons
46. Dynamics of persimmon cultivation by world regions, 2017-2021, thousand tons
47. The main operators of the fruit market in Azerbaijan
48. The main operators of the fruit market in the Black Sea-Caspian region
49. Major operators in the global fruit market
50. Sales volumes of competing companies
51. Assessment of the competitive environment in the market according to the method of M. Porter
52. Assessment of the competitive environment in the market of fruits and nuts in the Black Sea-Caspian region
53. The results of the assessment of the competitive environment in the fruit and nuts market of the Black Sea-Caspian region
54. Dynamics of exports of certain types of fruits and nuts from studied countries by product type in 2017-2021, in volume, thousand tons
55. Dynamics of exports of studied types of fruits and nuts by country in 2017-2021, in volume, thousand tons
56. Dynamics of exports of apples by country in 2017-2021, in volume, thousand tons
57. Geography of exports of apples from studied countries in 2017-2021, in volume, thousand tons
58. Dynamics of export prices for apples by country in 2017-2021, $/kg
59. Dynamics of exports of peaches (including nectarines) by country in 2017-2021, in volume, thousand tons
60. Geography of exports of peaches (including nectarines) from studied countries in 2017-2021, in volume, thousand tons
61. Dynamics of export prices for peaches (including nectarines) by country in 2017-2021, $/kg
62. Dynamics of exports of pears by country in 2017-2021, in volume, thousand tons
63. Geography of exports of pears from studied countries in 2017-2021, in volume, thousand tons
64. Dynamics of export prices for pears by country in 2017-2021, $/kg
65. Dynamics of exports of sweet cherries by country in 2017-2021, in volume, thousand tons – estimated*
66. Geography of exports of cherries from studied countries in 2017-2021, in volume, thousand tons (without estimation of sweet cherries share)
67. Dynamics of export prices for sweet cherries by country in 2017-2021, $/kg
68. Dynamics of exports of persimmons by country in 2017-2021, in volume, thousand tons
69. Geography of exports of persimmons from studied countries in 2017-2021, in volume, thousand tons
70. Dynamics of export prices for persimmons by country in 2017-2021, $/kg
71. Dynamics of exports of plums and sloes by country in 2017-2021, in volume, thousand tons
72. Geography of exports of plums and sloes from studied countries in 2017-2021, in volume, thousand tons
73. Dynamics of export prices for plums and sloes by country in 2017-2021, $/kg
74. Dynamics of exports of apricots by country in 2017-2021, in volume, thousand tons
75. Geography of exports of apricots from studied countries in 2017-2021, in volume, thousand tons
76. Dynamics of export prices for apricots by country in 2017-2021, $/kg
77. Dynamics of exports of quinces by country in 2017-2021, in volume, thousand tons
78. Geography of exports of quinces from studied countries in 2017-2021, in volume, thousand tons
79. Dynamics of export prices for quinces by country in 2017-2021, $/kg
80. Dynamics of exports of frozen fruits by country in 2017-2021, in volume, thousand tons
81. Geography of exports of frozen fruits from studied countries in 2017-2021, in volume, thousand tons
82. Dynamics of export prices for frozen fruits by country in 2017-2021, $/kg
83. Dynamics of exports of almonds by country in 2017-2021, in volume, thousand tons
84. Geography of exports of almonds from studied countries in 2017-2021, in volume, thousand tons
85. Dynamics of export prices for almonds by country in 2017-2021, $/kg
86. Dynamics of exports of hazelnuts by country in 2017-2021, in volume, thousand tons
87. Geography of exports of hazelnuts from studied countries in 2017-2021, in volume, thousand tons
88. Dynamics of export prices for hazelnuts by country in 2017-2021, $/kg
89. Dynamics of imports of certain types of fruits and nuts in studied countries by product type in 2017-2021, in volume, thousand tons
90. Dynamics of imports of studied types of fruits and nuts by country in 2017-2021, in volume, thousand tons
91. Dynamics of imports of apples by country in 2017-2021, in volume, thousand tons
92. Geography of imports of apples in studied countries in 2017-2021, in volume, thousand tons
93. Dynamics of import prices for apples by country in 2017-2021, $/kg
94. Dynamics of imports of peaches (including nectarines) by country in 2017-2021, in volume, thousand tons
95. Geography of imports of peaches (including nectarines) in studied countries in 2017-2021, in volume, thousand tons
96. Dynamics of import prices for peaches (including nectarines) by country in 2017-2021, $/kg
97. Dynamics of imports of pears by country in 2017-2021, in volume, thousand tons
98. Geography of imports of pears in studied countries in 2017-2021, in volume, thousand tons
99. Dynamics of import prices for pears by country in 2017-2021, $/kg
100. Dynamics of imports of sweet cherries by country in 2017-2021, in volume, thousand tons – estimated*
101. Geography of imports of cherries in studied countries in 2017-2021, in volume, thousand tons (without estimation of sweet cherries share)
102. Dynamics of import prices for sweet cherries by country in 2017-2021, $/kg
103. Dynamics of imports of persimmons by country in 2017-2021, in volume, thousand tons
104. Geography of imports of persimmons in studied countries in 2017-2021, in volume, thousand tons
105. Dynamics of import prices for persimmons by country in 2017-2021, $/kg
106. Dynamics of imports of plums and sloes by country in 2017-2021, in volume, thousand tons
107. Geography of imports of plums and sloes in studied countries in 2017-2021, in volume, thousand tons
108. Dynamics of import prices for plums and sloes by country in 2017-2021, $/kg
109. Dynamics of imports of apricots by country in 2017-2021, in volume, thousand tons
110. Geography of imports of apricots in studied countries in 2017-2021, in volume, thousand tons
111. Dynamics of import prices for apricots by country in 2017-2021, $/kg
112. Dynamics of imports of quinces by country in 2017-2021, in volume, thousand tons
113. Geography of imports of quinces in studied countries in 2017-2021, in volume, thousand tons
114. Dynamics of import prices for quinces by country in 2017-2021, $/kg
115. Dynamics of imports of frozen fruits by country in 2017-2021, in volume, thousand tons
116. Geography of imports of frozen fruits in studied countries in 2017-2021, in volume, thousand tons
117. Dynamics of import prices for frozen fruits by country in 2017-2021, $/kg
118. Dynamics of imports of almonds by country in 2017-2021, in volume, thousand tons
119. Geography of imports of almonds in studied countries in 2017-2021, in volume, thousand tons
120. Dynamics of import prices for almonds by country in 2017-2021, $/kg
121. Dynamics of imports of hazelnuts by country in 2017-2021, in volume, thousand tons
122. Geography of imports of hazelnuts in studied countries in 2017-2021, in volume, thousand tons
123. Dynamics of import prices for hazelnuts by country in 2017-2021, $/kg
124. Availability of fresh fruits and nuts in online stores of the studied countries and regions
125. Availability of dried and frozen fruits and nuts in online stores of the studied countries and regions
126. Availability of juices and jams in online stores of the studied countries and regions
127. Availability of other related products in online stores of the studied countries and regions
128. Description of the USP of potential competitors at the national level
129. Description of the USP of potential competitors at the regional level
130. Description of the USP of potential competitors at the global level
131. Table
132. Consumption of dried fruits in tons
133. Consumption of fruits and berries in the Russian Federation. (per capita per year; kilograms)
134. Fruit consumption per capita in 2017-2019, kg
135. Most consumed fruits and nuts by country
136. Average consumption of fruits and nuts in the world 2017-2020, kg
137. SWOT analysis of company Agrarco in the market
138. PESTLE-analysis of the fruit and nut market at the national level
139. PESTLE-analysis of the fruit and nut market at the regional level
140. PESTLE-analysis of the fruit and nut market at the global level
141. Segmentation of market risks
142. Risk map of the fruit and nuts market in national level
143. Risk map of the fruit and nuts market in regional level
144. Risk map of the fruit and nuts market in global level
List of graphs and charts:
1. Main climate change impacts on the agriculture sector for the main biogeographical regions in Europe
2. Apple consumption, kg per capita, 2019
3. Nectarines consumption in Spain, kg per capita, 2018
4. Cherry consumption in different countries (in metric tons)
5. Quince consumption in different countries (in metric tons)
6. Almond consumption, kg per capita, 2019
7. Hazelnuts consumption, kg per capita, 2019
8. Structure of consumption of the studied fruits and nuts by types, Armenia, 2020
9. Structure of consumption of the studied fruits and nuts by types, Azerbaijan, 2020
10. Structure of consumption of the studied fruits and nuts by types, Georgia, 2020
11. Structure of consumption of the studied fruits and nuts by types, Iran, 2020
12. Structure of consumption of the studied fruits and nuts by types, Kazakhstan, 2020
13. Structure of consumption of the studied fruits and nuts by types, Russian Federation, 2020
14. Structure of consumption of the studied fruits and nuts by types, Turkey, 2020
15. Structure of consumption of the studied fruits and nuts by types, Turkmenistan, 2020
16. Dynamics of growing almonds in the countries of the Black Sea-Caspian region, 2017-2021, tons
17. Dynamics of growing hazelnuts in the countries of the Black Sea-Caspian region, 2017-2021, tons
18. Dynamics of apple cultivation in the countries of the Black Sea-Caspian region, 2017-2021, tons
19. Dynamics of cultivation of peaches and nectarines in the countries of the Black Sea-Caspian region, 2017-2021, tons
20. Dynamics of pear cultivation in the countries of the Black Sea-Caspian region, 2017-2021, tons
21. Dynamics of apricot cultivation in the countries of the Black Sea-Caspian region, 2017-2021, tons
22. Dynamics of plum cultivation in the countries of the Black Sea-Caspian region, 2017-2021, tons
23. Dynamics of cherry cultivation in the countries of the Black Sea-Caspian region, 2017-2021, tons
24. Dynamics of quince cultivation in the countries of the Black Sea-Caspian region, 2017-2021, tons
25. Dynamics of persimmon cultivation in the countries of the Black Sea-Caspian region, 2017-2021, tons
26. Dynamics of exports of certain types of fruits and nuts from studied countries in 2017-2021, in volume, thousand tons
27. Structure of exports of certain types of fruits and nuts from studied countries in 2017-2021, in volume
28. Dynamics of exports of apples in 2017-2021, in volume, thousand tons
29. Dynamics of exports of peaches (including nectarines) in 2017-2021, in volume, thousand tons
30. Dynamics of exports of pears in 2017-2021, in volume, thousand tons
31. Dynamics of exports of sweet cherries in 2017-2021, in volume, thousand tons – estimated*
32. Dynamics of exports of persimmons in 2017-2021, in volume, thousand tons
33. Dynamics of exports of plums and sloes in 2017-2021, in volume, thousand tons
34. Dynamics of exports of apricots in 2017-2021, in volume, thousand tons
35. Dynamics of exports of quinces in 2017-2021, in volume, thousand tons
36. Dynamics of exports of frozen fruits in 2017-2021, in volume, thousand tons
37. Dynamics of exports of almonds in 2017-2021, in volume, thousand tons
38. Dynamics of exports of hazelnuts in 2017-2021, in volume, thousand tons
39. Dynamics of imports of certain types of fruits and nuts in studied countries in 2017-2021, in volume, thousand tons
40. Structure of imports of certain types of fruits and nuts in studied countries in 2017-2021, in volume
41. Dynamics of imports of apples in 2017-2021, in volume, thousand tons
42. Dynamics of imports of peaches (including nectarines) in 2017-2021, in volume, thousand tons
43. Dynamics of imports of pears in 2017-2021, in volume, thousand tons
44. Dynamics of imports of sweet cherries in 2017-2021, in volume, thousand tons – estimated*
45. Dynamics of imports of persimmons in 2017-2021, in volume, thousand tons
46. Dynamics of imports of plums and sloes in 2017-2021, in volume, thousand tons
47. Dynamics of imports of apricots in 2017-2021, in volume, thousand tons
48. Dynamics of imports of quinces in 2017-2021, in volume, thousand tons
49. Dynamics of imports of frozen fruits in 2017-2021, in volume, thousand tons
50. Dynamics of imports of almonds in 2017-2021, in volume, thousand tons
51. Dynamics of imports of hazelnuts in 2017-2021, in volume, thousand tons
52. Average export and import prices for apples by region and country in 2021, $/kg
53. Average export and import prices for peaches (including nectarines) by region and country in 2021, $/kg
54. Average export and import prices for pears by region and country in 2021, $/kg
55. Average export and import prices for cherries by region and country in 2021, $/kg
56. Average export and import prices for persimmons by region and country in 2021, $/kg
57. Average export and import prices for plums and sloes by region and country in 2021, $/kg
58. Average export and import prices for apricots by region and country in 2021, $/kg
59. Average export and import prices for quinces by region and country in 2021, $/kg
60. Average export and import prices for almonds by region and country in 2021, $/kg
61. Average export and import prices for hazelnuts by region and country in 2021, $/kg
62. Average retail prices for apples by region and country in 2021, $/kg
63. Average retail prices for peaches and nectarines by region and country in 2021, $/kg
64. Average retail prices for pears by region and country in 2021, $/kg
65. Average retail prices for cherries by region and country in 2021, $/kg
66. Average retail prices for persimmons by region and country in 2021, $/kg
67. Average retail prices for plums by region and country in 2021, $/kg
68. Average retail prices for apricots by region and country in 2021, $/kg
69. Average retail prices for almonds by region and country in 2021, $/kg
70. Average retail prices for hazelnuts by region and country in 2021, $/kg
71. Fruit consumption per capita in 2017-2019, kg
72. Hazelnut consumption in metric tons 2020
73. Almond consumption in metric tons 2020
74. Fruit market capacity 2017-2020
75. Marketing channels for fruits and nuts in Georgia
76. Marketing channels for fruits and nuts in Azerbaijan
77. Marketing channels for fruits and nuts in Turkey
78. Marketing channels for fruits and nuts in USA
79. Global packaged fresh fruits market, million US dollars, 2022-2030
80. Global dried fruits market, million US dollars, 2022-2030
81. Global nuts market, million US dollars, 2022-2030
82. Revenue in the Fruits & Nuts, million US dollars, Azerbaijan, 2022-2030
83. Revenue in the Fruits & Nuts, million US dollars, Armenia, 2022-2030
84. Revenue in the Fruits & Nuts, million US dollars, Iran, 2022-2030
85. Revenue in the Fruits & Nuts, million US dollars, Turkey, 2022-2030
86. Revenue in the Fruits & Nuts, million US dollars, Russia, 2022-2030
87. Revenue in the Fruits & Nuts, million US dollars, Georgia, 2022-2030
88. Revenue in the Fruits & Nuts, million US dollars, Kazakhstan, 2022-2030
89. Revenue in the Fruits & Nuts, million US dollars, Turkmenistan, 2022-2030
