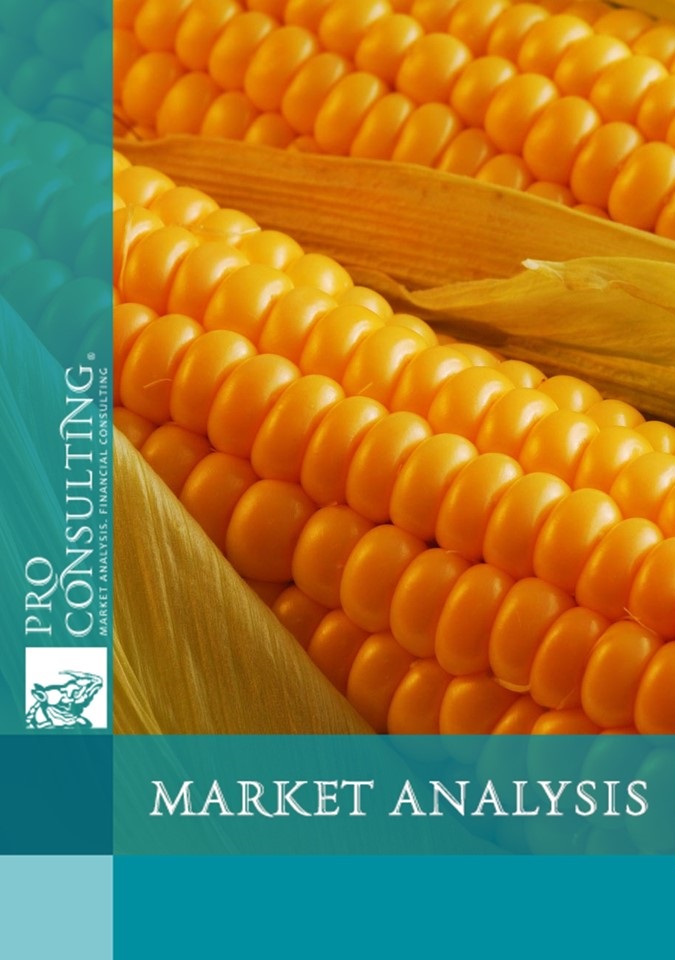
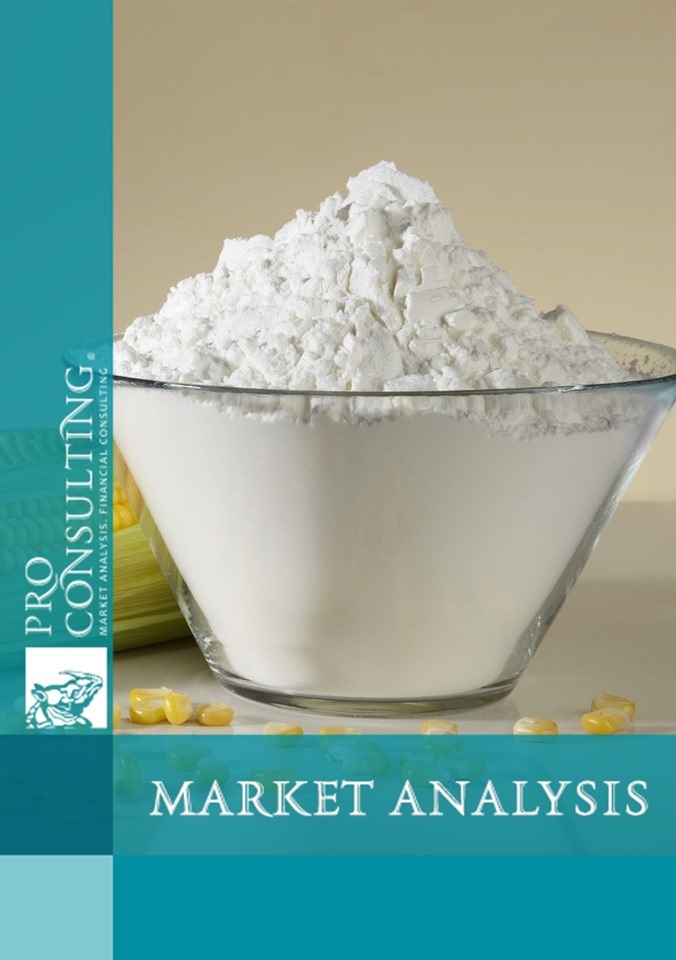
Market research report on deep processing of corn in Ukraine. 2023 year
| Date of Preparation: | July 2023 year |
| Number of pages: | 52 Arial, 1 spacing, 10 pt |
| Graphs and charts: | 64 |
| Tables: | 15 |
| Payment method: | prepayment |
| Production method: | e-mail or courier electronically or in printed form |
| Report language: | ukrainian, russian, english |
- This report can be updated and customized based on your business goals; you can also purchase part of report (no less than 50%) at a more affordable price
- Failed to find your market research report? - contact us
- You can also order feasibility study and business plan for your business idea


Detailed contents:
1. General characteristics of the market
1.1. Market description (general)
1.2. Analysis of market development trends (factors of influence, development problems)
1.3. General market indicators, calculation of market capacity in 2021-2022 (production + imports - exports) by country for each product
1.4. Assessment of the shadow segment in the market in Ukraine for each product
1.5. Segmentation and structuring of the market (by type, origin) in Ukraine
1.6. Raw material base, production technology (globally)
2. Key market operators (producers and importers), Ukraine
2.1. List of major market operators and their structuring (general information, types of activity and specialisation; product groups) in Ukraine and abroad
2.2. Market shares of the main market operators in Ukraine
2.3. Degree of competition and risks in Ukraine
3. Production of products in 2021-2022, Ukraine, by each product
3.1. Dynamics of production in quantitative terms
3.2. Dynamics of production in value terms
3.3 Shares of producers in Ukraine and abroad (estimate)
4. Foreign trade and foreign economic activity
4.1 Exports from Ukraine in 2021-2022 (volumes, structure, geography, shares of exporters)
4.2 Imports to Ukraine in 2021-2022 (volumes, structure, geography, shares of importers)
5. Price and pricing in the market
5.1. Average current prices for products (Ukraine)
5.2. Description of factors influencing price formation, structure
6. Analysis of consumption in the market
6.1. Portrait of the consumer
6.2. Structuring and segmentation of consumption
6.3. The need for goods. Unmet need for products in foreign markets
7. Conclusions. Forecast indicators of the market
7.1. Conclusions and forecast trends in the market (Ukraine)
7.2. Building hypotheses of market development. Forecast indicators of market development in 2023-2024
7.3. Recommendations for development in the market (export potential, by region, by product)
8. Investment attractiveness of the industry
8.1. SWOT analysis of the Customer's company in the market
8.2. PEST LE - analysis of factors influencing the market
8.3. Existing risks and barriers to market entry. Building a risk map in the market
List of Tables:
1. Market capacity of deeply processed corn products in Ukraine in 2021-2022 in physical terms, thsd tonnes
2. Approximate consumption rates of raw materials, energy resources and excipients in the production of glucose-fructose syrup (GFS)
3. The main operators of the deep processing of corn in Ukraine
4. The main operators in the market of deep processing of corn in the world
5. Average current retail prices for corn processed products in Ukraine as of June 2023 per package
6. Average current wholesale prices for corn processed products in Ukraine as of June 2023, UAH/kg
7. Cost structure of deeply processed corn products
8. Top 10 countries importing corn starch in the world and the share of Ukrainian exports, thsd tonnes, %.
9. Top 10 importing countries of citric acid in the world and share of Ukrainian exports, thousand tonnes, % 10.
10. Top 10 countries importing amino acids in the world and the share of Ukrainian exports, thousand tonnes, % 11.
11. Top 10 importing countries of corn gluten and gluten feed in the world and share of Ukrainian exports, thsd tonnes, % 12.
12. SWOT-analysis of the market direction
13. PEST LE matrix - analysis of factors influencing the market of deep processing of corn in Ukraine
14. Segmentation of market risks
15. Risk map of the corn deep processing market in Ukraine
List of graphs and charts:
1. Corn yields in Ukraine in 2019-2022.
2. Dynamics of corn starch production in Ukraine in 2021-2022 in physical terms, thsd tonnes
3. Dynamics of citric acid production in Ukraine in 2021 - 2022 in physical terms, t
4. Dynamics of lysine production in Ukraine in 2021-2022 in physical terms, t
5. Dynamics of glutamine production in Ukraine in 2021-2022 in physical terms, t
6. Dynamics of glycine production in Ukraine in 2021-2022 in physical terms, t
7. Dynamics of corn gluten and gluten feed production in Ukraine in 2021-2022 in physical terms, thousand tonnes
8. Dynamics of corn starch production in Ukraine in 2021-2022 in value terms, UAH million
9. Dynamics of citric acid production in Ukraine in 2021-2022 in value terms, UAH million
10. Dynamics of lysine production in Ukraine in 2021-2022 in value terms, UAH million
11. Dynamics of glutamine production in Ukraine in 2021-2022 in value terms, UAH million
12. Dynamics of glycine production in Ukraine in 2021-2022 in value terms, UAH million
13. Dynamics of production of corn gluten and gluten feed in Ukraine in 2021-2022 in value terms, UAH million
14. Dynamics of corn starch exports from Ukraine in 2021-2022 in physical terms, thousand tonnes
15. Dynamics of corn starch exports from Ukraine in 2021-2022 in monetary terms, UAH mln
16. Geography of corn starch exports from Ukraine in 2021-2022 in physical terms, %.
17. Dynamics of citric acid exports from Ukraine in 2021-2022 in physical terms, thousand tonnes
18. Dynamics of citric acid exports from Ukraine in 2021-2022 in monetary terms, UAH million
19. Geography of citric acid exports from Ukraine in 2021-2022 in physical terms, %.
20. Shares of citric acid exporters from Ukraine in 2021 in physical terms, %.
21. Dynamics of lysine exports from Ukraine in 2021-2022 in physical terms, thousand tonnes
22. Dynamics of lysine exports from Ukraine in 2021-2022 in monetary terms, UAH million
23. Geography of lysine exports from Ukraine in 2021-2022 in physical terms, %.
24. Share of lysine exporters from Ukraine in 2021 in physical terms, %.
25. Dynamics of exports under code 292249 from Ukraine in 2021-2022 in physical terms, t
26. Dynamics of exports under code 292249 from Ukraine in 2021-2022 in monetary terms, UAH million
27. Geography of exports by code 292249 from Ukraine in 2021-2022 in physical terms, %.
28. Shares of exporters by code 292249 from Ukraine in 2021 in physical terms, %.
29. Dynamics of glutamine exports from Ukraine in 2021-2022 in physical terms, t
30. Dynamics of glutamine exports from Ukraine in 2021-2022 in physical terms, t
31. Dynamics of exports of corn gluten and gluten feed from Ukraine in 2021-2022 in physical terms, thousand tonnes
32. Dynamics of exports of corn gluten and gluten feed from Ukraine in 2021-2022 in monetary terms, UAH million
33. Geography of exports of corn gluten and gluten feed from Ukraine in 2021-2022 in physical terms, %.
34. Shares of corn gluten and gluten feed exporters from Ukraine in 2021 in physical terms, %.
35. Dynamics of corn starch imports to Ukraine in 2021-2022 in physical terms, thsd tonnes
36. Dynamics of corn starch imports to Ukraine in 2021-2022 in monetary terms, UAH mln
37. Geography of corn starch imports to Ukraine in 2021-2022 in physical terms, %.
38. Share of corn starch importers to Ukraine in 2021-2022 in physical terms, %.
39. Dynamics of citric acid imports to Ukraine in 2021-2022 in physical terms, thousand tonnes
40. Dynamics of citric acid imports to Ukraine in 2021-2022 in monetary terms, UAH million
41. Geography of citric acid imports to Ukraine in 2021-2022 in physical terms, %.
42. Share of citric acid importers to Ukraine in 2021-2022 in physical terms, %.
43. Dynamics of lysine imports to Ukraine in 2021-2022 in physical terms, thousand tonnes
44. Dynamics of lysine imports to Ukraine in 2021-2022 in monetary terms, UAH million
45. Geography of lysine imports to Ukraine in 2021-2022 in physical terms, %.
46. Shares of lysine importers to Ukraine in 2021-2022 in physical terms, %.
47. Dynamics of glycine imports to Ukraine in 2021-2022 in physical terms, thousand tonnes
48. Dynamics of wisteria imports to Ukraine in 2021-2022 in monetary terms, UAH million
49. Geography of wisteria imports to Ukraine in 2021-2022 in physical terms, %.
50. Share of wisteria importers to Ukraine in 2021-2022 in physical terms, %.
51. Dynamics of glutamine imports to Ukraine in 2021-2022 in physical terms, thousand tonnes
52. Dynamics of glutamine imports to Ukraine in 2021-2022 in monetary terms, UAH million
53. Geography of glutamine imports to Ukraine in 2021-2022 in physical terms, %.
54. Share of glutamine importers to Ukraine in 2021-2022 in physical terms, %.
55. Dynamics of imports of corn gluten and gluten feed to Ukraine in 2021-2022 in physical terms, thousand tonnes
56. Dynamics of imports of corn gluten and gluten feed to Ukraine in 2021-2022 in monetary terms, UAH million
57. Share of importers of corn gluten and gluten feed to Ukraine in 2021-2022 in physical terms, %.
58. Structure of corn starch consumption in the world
59. Forecast indicators of corn starch market capacity in 2023-2024 in Ukraine in physical terms, thousand tonnes
60. Forecast indicators of citric acid market capacity in 2023-2024 in Ukraine in physical terms, thousand tonnes
61. Forecast indicators of lysine market capacity in 2023-2024 in Ukraine in physical terms, thousand tonnes
62. Forecast indicators of glutamine market capacity in 2023-2024 in Ukraine in physical terms, thousand tonnes
63. Forecast indicators of glycine market capacity in 2023-2024 in Ukraine in physical terms, thousand tonnes
64. Forecasted market capacity of corn gluten and gluten feed in Ukraine in 2023-2024 in physical terms, thousand tonnes
