1797
Analysts at Pro-Consulting prepared reseacrh of clothing markets in Ukraine and Kiev
 However, despite the popularity of these markets, the overall situation has changed during the last five years. Thus, the popularity of clothing markets has dropped substantially. The economic crisis has significantly affected their work and the work of major competitors - respectable trading institutions, slowed down implementation of new retail space. In Kiev rents in this area fell by 40-60%. The number of available retail spaces both on markets and successful shopping centers has doubled, and increased fivefold - at less succsessfull. But, in contrast to stagnant clothing markets, shopping centers have quickly returned to their original positions. Furthermore, due to the increasing demand they began to show growth. Following the construction of the capital of vitality in commercial areas and in other cities.
Today about 35-45% of Ukrainians do shopping at the clothing markets. In order to maximize the efficiency of the markets renters are selected from the more respectable structures. The advertising is also used; visitors have the opportunity to relax and have fun, as well as to shop. These steps are relevant to owners and entrepreneurs markets. Many players show a desire to invest in the modernization of outdated infrastructure, which are forced to use, as well as in the design and marketing in order to keep the flue consumers.
At the end of 2011 -2013 years, the number of clothing markets declined dramatically. For example, on January 1, 2011, there were about 349 markets, specializing in clothes, shoes, etc. However, in 2012 the growth rate showed a negative trend of -8.3%. During this period, there were 320 clothing markets. On 1 January 2013 the situation was repeated, and the total number of markets amounted to 308 units. This statistic highlights the tendency to reduce the number of clothing markets, which emerged in recent years in Ukraine.
The total number of clothing markets and shopping places in Ukraine in 2011-2013., pieces.
(January 1st)
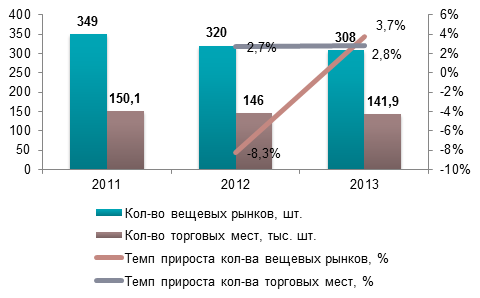
Source: State Statistics Committee of Ukraine, the assessment Pro - Consulting
Considering the structure of Ukrainians expenditure during the month, it can be argued that more than half of the expenditure allocated to food and drinks. Also significant portion allocated to utilities (more than 10% per month), and only the third-largest expenditure allocated to clothing and footwear (7.5%).
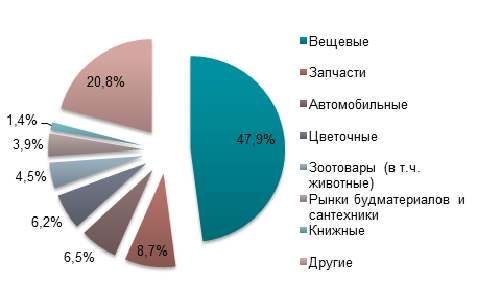
The structure of the Ukrainian non-food market according to the type of activity, the end of 2012,%
Source: State Statistics Committee of Ukraine, the assessment Pro - Consulting
Based on the data, it is appropriate to consider the structure of non-food market and its components. Thus, clothing markets occupied 47.9% of the total market share. It is followed by spare parts markets, with a market share of 8.7%. In third place - the automotive markets (6.5%), then flower markets - 6.2%. Smaller markets, specializing in the sale of pets and animals (4.5%), building materials and sanitary markets (3.9%), book markets (1.4%).
This analysis allows us to trace the main trends in the development of this market, and learn about the prospects for its development in the coming years.
Analytical study of Pro-Consulting will help you to correctly plan your business, avoid mistakes in the future and make the most effective solutions.
Complete market research: http://pro-consulting.ua/products/128107-analiz-veshevyh-rynkov-ukrainy-i-kieva-2013-god.html
Date of placement: 04.07.2013
next
