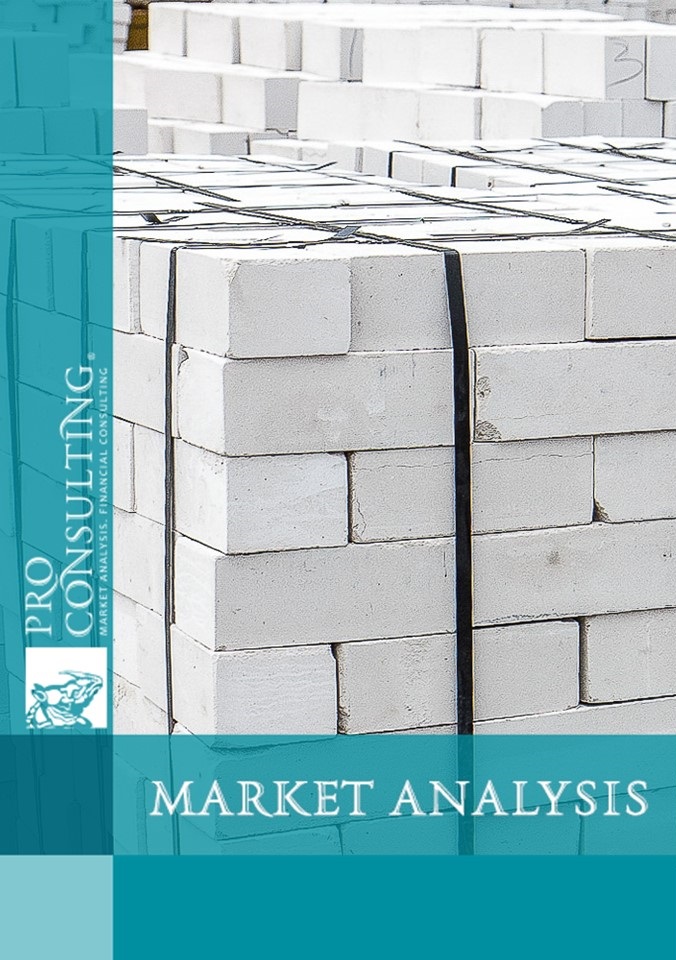
Analysis of Ukraine silicate brick market. 2019 year
| Date of Preparation: | November 2019 year |
| Number of pages: | 19, Arial, 1 interval, 10 pt |
| Graphs and charts: | 6 |
| Tables: | 6 |
| Payment method: | prepayment |
| Production method: | e-mail or courier electronically or in printed form |
| Report language: | russian |
- This report can be updated and customized based on your business goals; you can also purchase part of report (no less than 50%) at a more affordable price
- Failed to find your market research report? - contact us
- You can also order feasibility study and business plan for your business idea


Detailed contents:
1. Analysis of market development trends (market impact factors, problems, development trends)
2. Analysis of silicate brick production in Ukraine in 2018 - 9 months 2019, in kind (based on estimate)
3. Major operators in the silicate brick market in Ukraine:
3.1. The list of major market operators (TOP-10 manufacturers) and their description:
3.1.1. Production capacity (if information available)
3.1.2. Regional location of major operators
3.1.3. Products range (silicate bricks and other products in general)
3.2. Analysis of equipment and raw materials imports for the silicate bricks production in 2016 - 10 months 2019 by major market operators in Ukraine
3.3. Major market operators shares in Ukraine in 2018, in kind (based on estimates, including exports data)
3.3.1. Selection of the manufactured goods for the domestic and foreign markets shares in kind
3.3.2. Estimation of major operators' capacity utilization in 2018 (if production capacity data available)
3.4. Major operators' financial results in 2018 (revenue, margin, profitability, net profit)
4. Analysis of the state tenders for the silicate brick purchase in 2018 - 9 months 2019, by section: product, volume, value, buyer company
5. Monitoring of mass media for major market operators' business expansion plans, investments, new products
6. Conclusions and forecast market development tendencies
List of Tables:
1. Top 10 silicate bricks manufacturers
2. Production capacity (if information available) and the level of fixed assets utilization, in kind
3. Regional location of major market operators, with production share selection in the region, in kind,%
4. Market operators imports of Raw materials and equipment for the silicate brick production, in monetary terms, thousands USD
5. The level of fixed assets utilization, in kind
6. Major operators Financial results in 2018 (revenue, margin, profitability, net profit), thousand UAH
List of graphs and charts:
1. Dynamics of buildings area (new construction) at the beginning of construction for 2018 - 6 months 2019, mln. m2
2. The volume of construction products manufactered in Ukraine, for 2018 - 3 quarters 2019, UAH billion
3. Silicate brick Production in Ukraine for 2018 - 9 months 2019, in kind, mln.pcs
4. Major operators' Market shares in Ukraine in 2018 - 9 months 2019, in kind,%
5. State tenders for the purchase of silicate brick in Prozorro system Volume for 2018 - 1-3 quarters 2019, thousand UAH
6. Prozorro tenders organizers' silicate brick purchase shares in 2018 - 1-3 quarters 2019, in monetary terms,%

