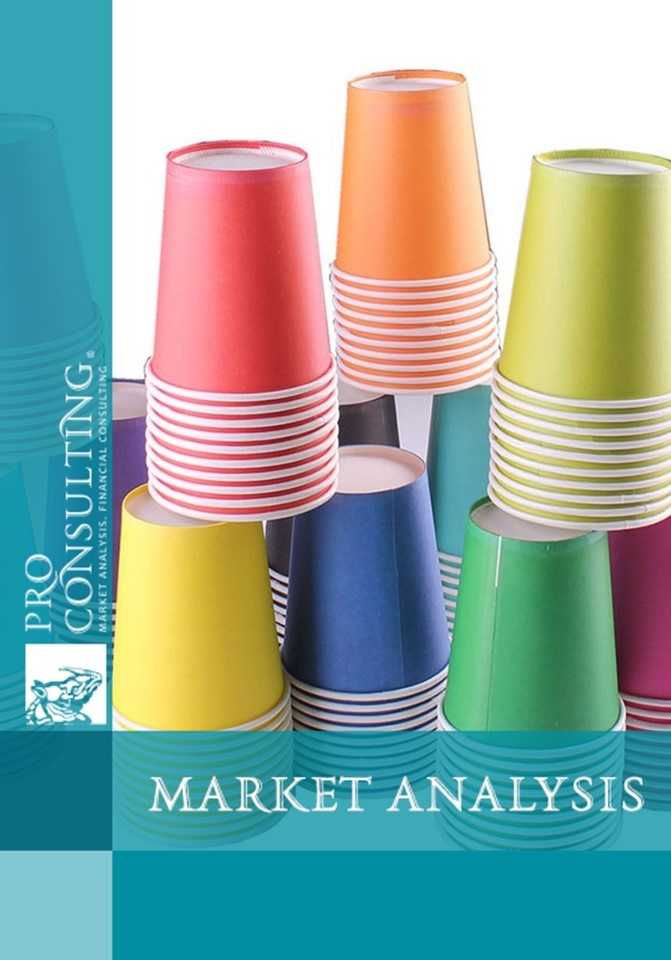
Market analysis of paper cups in Ukraine. 2020 year
| Date of Preparation: | April 2020 year |
| Number of pages: | 43, Arial, 1 interval, 10 pt |
| Graphs and charts: | 24 |
| Tables: | 18 |
| Payment method: | prepayment |
| Production method: | e-mail or courier electronically or in printed form |
| Report language: | ukrainian, russian, english |
- This report can be updated and customized based on your business goals; you can also purchase part of report (no less than 50%) at a more affordable price
- Failed to find your market research report? - contact us
- You can also order feasibility study and business plan for your business idea


Detailed contents:
1. General characteristics of the market in Ukraine
1.1. Analysis of market development trends in 2017-2019 (main trends, specifics, problems, market influencing factors)
1.2. General market indicators, calculation of market capacity (production + import - export) 2017-2019 in volume and value.
1.3. Segmentation and structuring of the market (estimation of the share of paper cups in the total market of disposable tableware; domestic / imported products / by size (estimation); estimation of the share of the shadow market
1.4. Raw material base for the production of cups
2. Dynamics of production in the market of paper cups in Ukraine
2.1. Dynamics of production in volume in 2017-2019
2.2. Dynamics of product sales in value in 2017-2019
2.3. Producer shares
3. The main operators of the paper cup market in Ukraine
3.1. Main operators (manufacturers and importers) and their list, description, contacts
3.2. Segmentation and structuring of the main market operators (regionally, by type of product, distribution channels, assortment (size, material, shape, etc.))
4. Foreign trade in the market
4.1. Export of products in 2017-2019 (volumes, structure by types, geography, shares of exporters)
4.2. Import of products in 2017-2019 (volumes, structure by types, geography, shares of importers)
5. Range and pricing in the market
5.1. Product range and average prices of manufacturers and wholesalers - comparison of prices for similar types of products, division into price segments and groups according to distribution channels (HoReCa, retail, etc.)
5.2. Description of factors influencing price formation, structure (based on producers' financial statements)
6. Consumption of products in the market
6.1. Consumer preferences regarding products, a portrait of the end consumer
6.2. Segmentation of consumers with the highlighting of the B2B and B2C segments. Analysis of marketing cases related to paper cups
6.3. Consumption trends amid plastic restrictions
6.4. Segmentation of the market for beverages used with paper cups
7. Conclusions. Forecast indicators
7.1. Conclusions and Forecast Trends of Disposable Paper Cup Market Development
7.2. Construction of market development hypotheses. Forecast indicators of market development in 2020-2023
7.3. Recommendations for development in the market
7.4. Forecast trends of the European market (analysis of data from open sources) to understand the prospects for exports of products
8. Investment attractiveness of the industry
8.1. SWOT analysis of the market
8.2. PESTLE-analysis of factors influencing the market
8.3. Existing risks and barriers to market entry. Building a risk map in the market for a new player
List of Tables:
1. Indicators of the market capacity of paper cups in Ukraine in 2017 - 2019
2. Major manufacturers of base papers in Ukraine
3. Major manufacturers in the market of paper cups in Ukraine
4. TOP-10 manufacturers of laminated cardboard and products made of it in Ukraine
5. Top importers in the paper cup market in 2019
6. Major producers of paper cups in Ukraine by region
7. Major importers of paper cups in Ukraine by region
8. Products of the largest manufacturers of paper cups
9. Main indicators of export of paper cups from Ukraine in 2017 - 2019, in volume (thousand tons) and value (million UAH)
10. Main indicators of imports of paper cups to Ukraine in 2017 - 2019, in volume (thousand tons) and money (million UAH)
11. Average current prices for smooth paper cups, including in color, with a pattern, by main types, UAH / piece.
12. Average current prices for corrugated paper cups in color by main types, UAH / piece.
13. Average current prices for paper cups with individual/thematic design by main types, UAH / piece.
14. The range of paper cups of large manufacturing companies
15. SWOT-analysis of the market of paper cups in Ukraine
16. PESTLE-analysis of the market of paper cups in Ukraine
17. The main risks in the Ukrainian market of disposable tableware
18. Ranking the risks of entering the paper cup market
List of graphs and charts:
1. Dynamics of indices of producers of paper pulp and cardboard, manufacture of paper and cardboard products and printing activities in Ukraine in 2013-2019, grows rate
2. Shares of domestic production and imported products in the market of paper cups in Ukraine in 2017 - 2019, %
3. Regional distribution of consumption in the market of paper cups in Ukraine in 2017 - 2019, %
4. Dynamics of the manufacture of wood products, paper and printing activities in Ukraine in 2014-2018, in value, million UAH.
5. Dynamics of production of paper cups in Ukraine for 2017 - 2019 in volume, thousand tons
6. Dynamics of the production of paper cups in Ukraine for 2017 - 2019 in value, million UAH
7. Market shares of the main manufacturers of paper cups in Ukraine, in volume, %
8. Main producers and importers of paper cups by regions of Ukraine
9. Dynamics of average prices for paper cups exported from Ukraine in 2016 - 2019, UAH/kg
10. Geographic structure of exports of paper cups from Ukraine in 2017 - 2019, in volume, %
11. Main exporting companies of paper cups from Ukraine in 2016 - 2017, in volume, %
12. Dynamics of average prices for paper cups imported to Ukraine in 2016 - 2019
13. Geographical structure of imports of paper cups to Ukraine in 2017 - 2019, in volume, %
14. The main importers of paper cups to Ukraine in 2017 - 2019, in volume,%
15. Characteristics of Future cup vending machine paper cups
16. Characteristics of Paper cup vending machine paper cups
17. Characteristics of paper cups for vending machines of the Aktiv company
18. Segmentation of consumers of paper cups in the B2B segment, %
19. Segmentation of consumers of paper cups by gender, %
20. Segmentation of consumers of paper cups in Ukraine by age, %
21. Segmentation of the market for drinks used with paper cups, depending on the temperature of the drink, %
22. Segmentation of the market for drinks used with paper cups, by alcohol content, %
23. Segmentation of the market for drinks used with paper cups by type of drinks, %
24. Forecast capacity of the paper cup market in Ukraine in 2020-2023, in volume, thousand tons
