Market analysis of aviation fuel, methanol and liquefied gas in Ukraine and European countries. 2022 year
| Date of Preparation: | February 2022 year |
| Number of pages: | 51, Arial, 1 interval, 10 pt |
| Graphs and charts: | 16 |
| Tables: | 28 |
| Payment method: | prepayment |
| Production method: | e-mail or courier electronically or in printed form |
| Report language: | ukrainian, russian, english |
- This report can be updated and customized based on your business goals; you can also purchase part of report (no less than 50%) at a more affordable price
- Failed to find your market research report? - contact us
- You can also order feasibility study and business plan for your business idea


Summary of the market analysis:
The Pro-Consulting company prepared an analysis of the aviation fuel, methanol and liquefied gas market in Ukraine and European countries.
The general market indicators of 2018-6 months of 2021 were analyzed: market trends, state regulation of the industry in Ukraine, market capacity, export, import were analyzed, conclusions were formed, trend forecast, the investment attractiveness of the market was analyzed.
The interest and relevance of the market research of aviation fuel, methanol and liquefied gas is due to the fact that today liquefied gas is one of the main representatives of the planet's energy resources; methanol is one of the most important large-tonnage products of the chemical industry; jet (aviation) fuel - used in aviation gas turbine engines and other flying objects, and can also be used as a coolant or coolant (fuel-air and fuel-oil radiators). This market does not show a stable dynamic of growth or decline, everything depends on different economic, political and social situations in different countries.
Because Europe has close trade ties, the markets of buyer countries are highly dependent on political and economic relations with exporting countries. For example: countries with the largest volumes of natural gas consumption: Russia, Germany, Great Britain, Italy, the Netherlands - the largest producers are concentrated in Russia, Azerbaijan, Great Britain, Norway and the Netherlands.
In 2020, the jet fuel market sank heavily as travel, especially passenger travel, was severely reduced due to COVID-19 quarantine restrictions. At the same time, already in 2021, consumption returned to the level of 2019. Since strict quarantine restrictions took place both in Europe and in Ukraine, the level of reduction in aviation fuel consumption was commensurate in all the countries studied. A decrease in 2020 also showed gas consumption, which was caused by a decrease in demand for the product itself as a final product and demand for electricity.
In connection with the escalation of the conflict between Russia and Ukraine, Germany has frozen the certification of Nord Stream-2. Considering that almost half of Europe's gas consumption is from Russia, this creates additional problems for the European gas market. At the same time, this creates additional opportunities for development (for example, the development of a network of terminals for liquefied natural gas for supplies from the United States).
Detailed contents:
1. Analysis of trends in the development of the researched products market in Ukraine and European countries (factors of influence on the market, development problems, opportunities)
2. General market indicators, calculation of market capacity in 2018–6 months of 2021 in kind:
- Ukraine
– Western Europe (Germany, Austria, Switzerland, Liechtenstein, Luxembourg, Netherlands, Belgium, France, Monaco, Italy, Spain, Portugal, Denmark, Finland, Ireland, Norway, Sweden and United Kingdom)
- Central Europe as a whole (Poland, Czech Republic, Slovakia, Hungary, Armenia, Romania, Albania, Latvia, Lithuania, Estonia, Belarus, Moldova, Bulgaria, Georgia, Russia (part), Greece, Azerbaijan, Croatia, Bosnia and Herzegovina, Slovenia , Serbia, Kosovo, Montenegro, North Macedonia)
3. State regulation of the industry in Ukraine. Taxes and fees in the market (general business taxation; import and export duties, plans to change them (if any))
4. The main operators of the Ukrainian market (manufacturers, importers of the studied products) and their characteristics (name, legal data, regionality, description of activities, product categories, production / import of products by years)
5. Import of researched products to Ukraine (volume, structure, geography, parts of importers)
6. The main operators in Central, Northern and Western Europe (up to TOP-20) for the production of the studied products and their characteristics (name, legal data, regionality, description of activities, product categories)
7. Average prices for the studied products in the context of 10 years, in the context of countries (by groups). Price forecast for the next 20 years ( All prices must be in euro-currency. Indicate the factors affecting the price and their forecast for the specified period. Predict the annual inflation rate)
8. Consumers in Ukraine and their characteristics:
8.1. The need for products. Portrait of the consumer and its structuring by the type of product under study.
8.2. Consumption of products in the B2G segment
9. Sales channels of the studied products in Ukraine (description and evaluation of sales by channels)
10. Forecast of expenditures on CO 2 (cost of CO 2 emissions ) until 2042 in Ukraine (EUR/ ton )
11. Conclusions. Forecast indicators
11.1. Conclusions and Forecast Trends in the Development of the Market of the Studied Products
11.2. Construction of market development hypotheses. Forecast characteristics of market development by 2042
12. Investment attractiveness of the industry
12.1. SWOT analysis of the market direction
List of Tables:
1. Calculation of the natural gas consumption (market capacity: production+imports-exports) in Ukraine and European countries in 2018-6 months of 2021, in physical terms, billion m3
2. Calculation of the methanol market capacity in Ukraine and European countries in 2018-6 months of 2021, in physical terms, thousand tons
3. Calculation of the methanol market capacity in Ukraine, Western and Central and Eastern Europe in 2018-6 months of 2021, in physical terms, thousand tons
4. The dynamics of fuel consumption for jet engines in Ukraine and European countries in 2018-6 months of 2021, in physical terms, thousand barrels per day
5. Calculation of the jet fuel market capacity in Ukraine, Western and Central and Eastern Europe in 2018-6 months of 2021, in physical terms, million barrels, million tons
6. Import customs and excise duty rates for researched products in Ukraine, as of February 2022
7. Shares of producers in the natural gas market in Ukraine in 2018 - the first half of 2021, in physical terms,%
8. Shares of importers in the methanol market in Ukraine in 2018 - the first half of 2021, in physical terms,%
9. Description of the main provisions in relation to Gazprom
10.Description of the main provisions of SOCAR
11.Description of the main provisions in relation to the company Total Energies
12.Description of the main provisions of Equinor
13.Description of key provisions in relation to BP
14.Description of Key Terms Regarding Neptune Energy
15.Description of key provisions regarding OCI ( BioMCN )
16.Description of the main provisions in relation to MSK
17.Description of the main provisions in relation to Socar Methanol LLC
18.Description of the main provisions in relation to the company JSC "Grodno Azot"
19.Description of the main provisions in relation to SARLUX
20.Description of the main provisions regarding ORLEN Lithuania
21.Description of the main provisions of the company Naftan
22.Hellenic 's main provisions Petroleum
23.Description of Maddox Key Terms Switzerland
24.Forecast of the cost of carbon dioxide emissions in Ukraine in 2022-2042, euro per ton
25.Forecast capacity of natural gas, methanol and jet fuel markets in Ukraine, Western Europe and Central and Eastern Europe in 2022-2042, in physical terms
26.SWOT analysis of the natural gas market
27.SWOT analysis of the methanol market
28.SWOT analysis of the jet fuel market
List of graphs and charts:
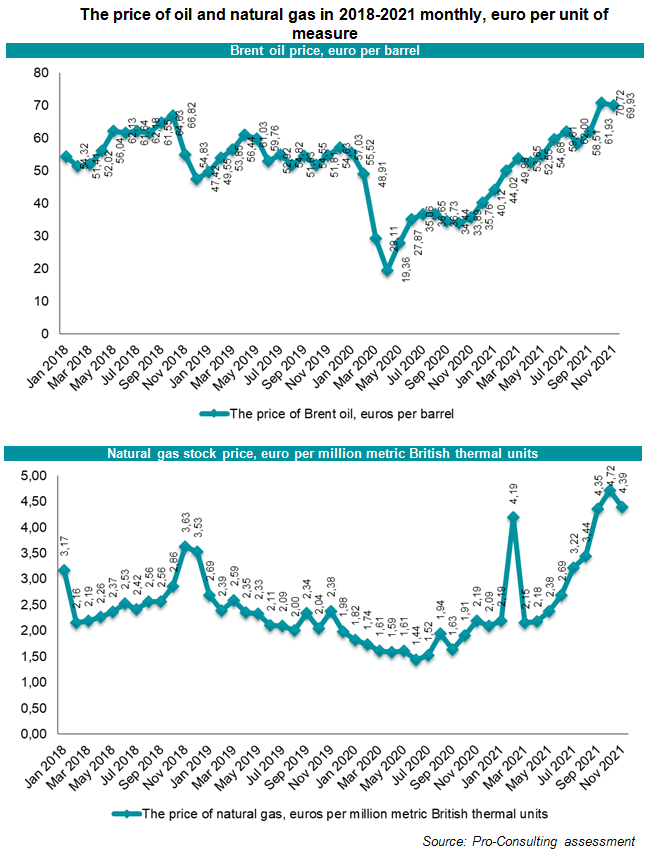
1. The price of oil and natural gas in 2018-2021 monthly, euro per unit of measure
2. Dynamics of imports of methanol (2905110000) to Ukraine in 2018-6 months of 2021, in physical terms, thousand tons
3. Geographical structure of methanol imports to Ukraine in 2018-6 months of 2021, in physical terms, %
4. Shares of methanol importers to Ukraine 2018-2021, in physical terms, %
5. Dynamics of jet fuel imports (2710127000) to Ukraine in 2018-6 months of 2021, in physical terms, t
6. Geographical structure of imports of jet engine fuel to Ukraine in 2020-2021, in physical terms, %
7. Shares of engine jet fuel importers to Ukraine 2020-2021, %
8. Average prices for gas, methanol and jet fuel in Ukraine, Western Europe, Central and Eastern Europe in 2012-2021, euro/unit
9. Brent Oil Price Forecast (EUR/BBL) and annual inflation rate (%) in the studied regions in 2022-2042.
10. Price forecast for natural gas, methanol and jet fuel in Ukraine, Western Europe, Central and Eastern Europe in 2022-2042, euro/unit (EXW including local inflation)
11. Structure of natural gas consumption in the world
12. Structure of methanol consumption in the world
13. Dynamics of the volumes of government purchases of natural gas fuel, methanol and jet fuel in 2018-6 months of 2021, in monetary terms, bln. UAH /thous. UAH
14. Structure of the natural gas market in Ukraine by distribution channels
15. The structure of the market for jet fuel (kerosene) in Ukraine by distribution channels
16. Forecast capacity of natural gas, methanol and jet fuel markets in Ukraine, Western Europe and Central and Eastern Europe in 2022-2042, in physical terms