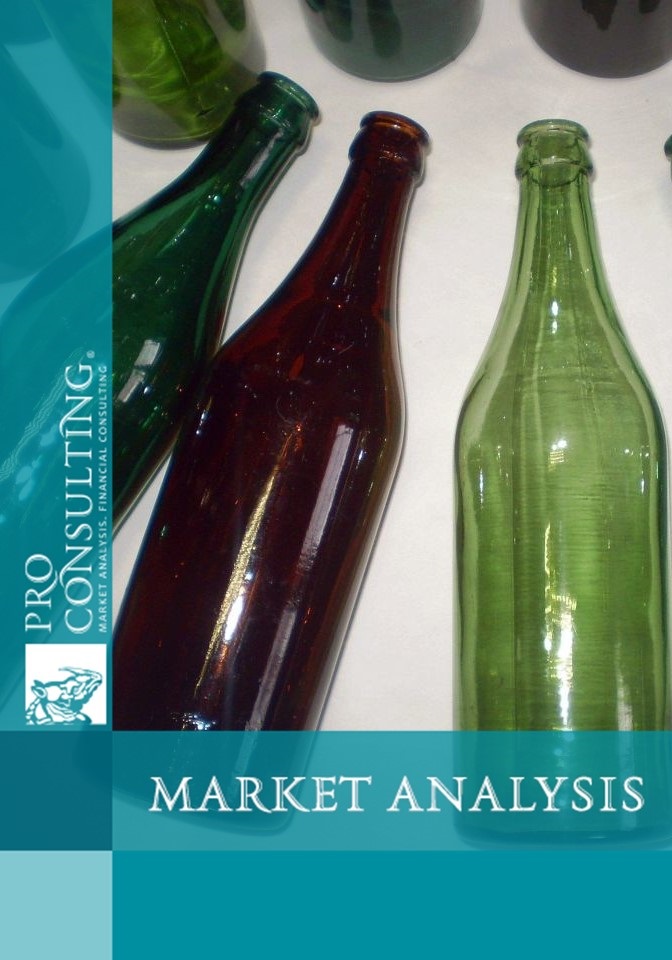
Research of glass container market of Ukraine. 2013

General characteristics
| Date of Preparation: | May 2013 year |
| Number of pages: | , Arial, 1 interval, 10 font |
| Graphs and charts: | 10 |
| Tables: | 3 |
| Payment method: | prepayment |
| Production method: | e-mail or courier electronically or in printed form |
- This report can be updated and customized based on your business goals; you can also purchase part of report (no less than 50%) at a more affordable price
- Failed to find your market research report? - contact us
- You can also order feasibility study and business plan for your business idea


Detailed contents:
1. The market capacity
2. Domestic production
3. Foreign economic activity
4. Consumption of products
5. Prices situation at the market
6. Market forecast
List of Tables:
1. The dynamics of the market capacity of glass containers in Ukraine in 2009-2012. (in real terms), mln.
2. Dynamics of production of glass containers by segment in Ukraine in 2009-2012. (in real terms), mln.
3. Dynamics of export and import of container glass in Ukraine in 2009-2012. (in real terms), mln.
List of graphs and charts:
1. The dynamics of the market capacity of glass containers in Ukraine in 2009-2012. (in real terms), mln.
2. Dynamics of production of glass containers in Ukraine in 2009-2012. (in real terms), mln.
3. Structure of production of glass containers in Ukraine in 2009-2012. (in real terms),%
4. Regional structure of exports of container glass of Ukraine in 2012 (in real terms),%
5. Regional pattern of import of container glass in Ukraine at the end of 2012 (in real terms),%
6. Structuring the import and export of glass in the context of colorless and colored glass up to 2012 (in real terms),%
7. Structure of the market of glass containers in Ukraine up to 2012 (in real terms),%
8. Structuring the European preferences by type of packaging for alcohol, soft drinks and hot drinks,%
9. Structure of sales of glass containers in Ukraine on trade channels (in real terms),%
10. Forward-looking indicators of the market of glass containers in Ukraine for 2013-2016. (in real terms), mln.