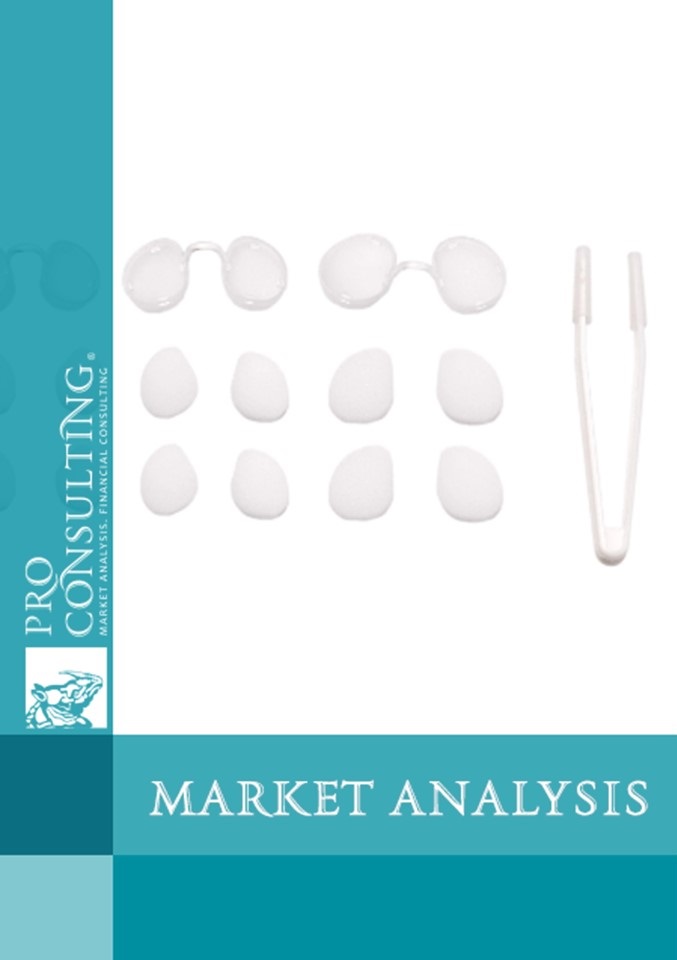
Market research report on US nasal filters and dilators market. 2016 year
| Date of Preparation: | December 2016 year |
| Number of pages: | 23, Arial,1 spacing, 10 pt |
| Graphs and charts: | 11 |
| Tables: | 5 |
| Payment method: | prepayment |
| Production method: | e-mail or courier electronically or in printed form |
| Report language: | ukrainian, russian, english |
- This report can be updated and customized based on your business goals; you can also purchase part of report (no less than 50%) at a more affordable price
- Failed to find your market research report? - contact us
- You can also order feasibility study and business plan for your business idea


Detailed contents:
1. Major competitors in the US market
1.1. Main competitors and their brief description with specification of possible additional lines of business
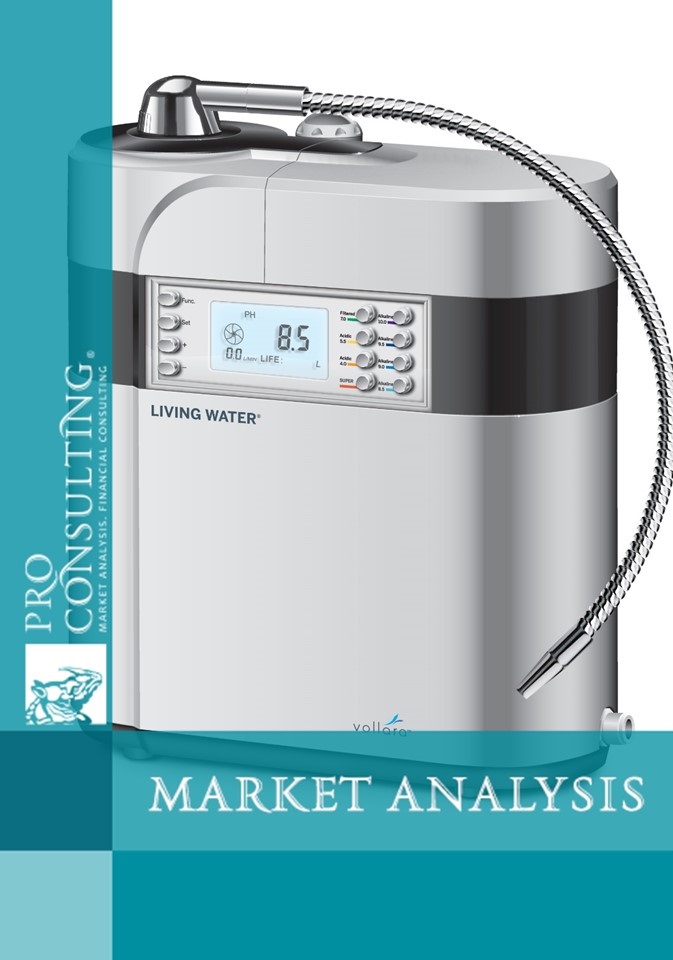
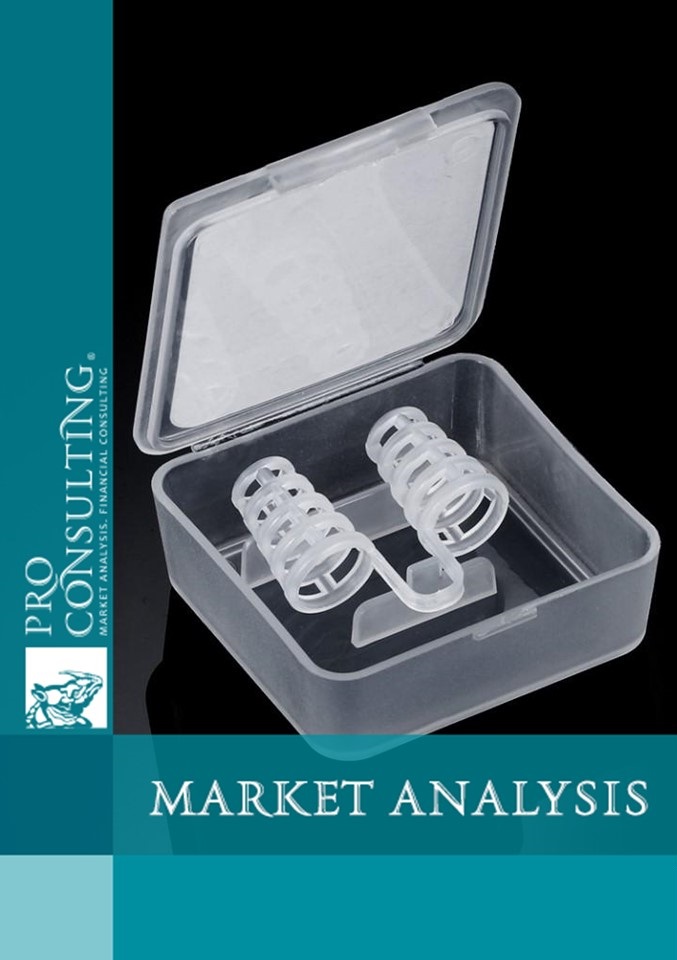
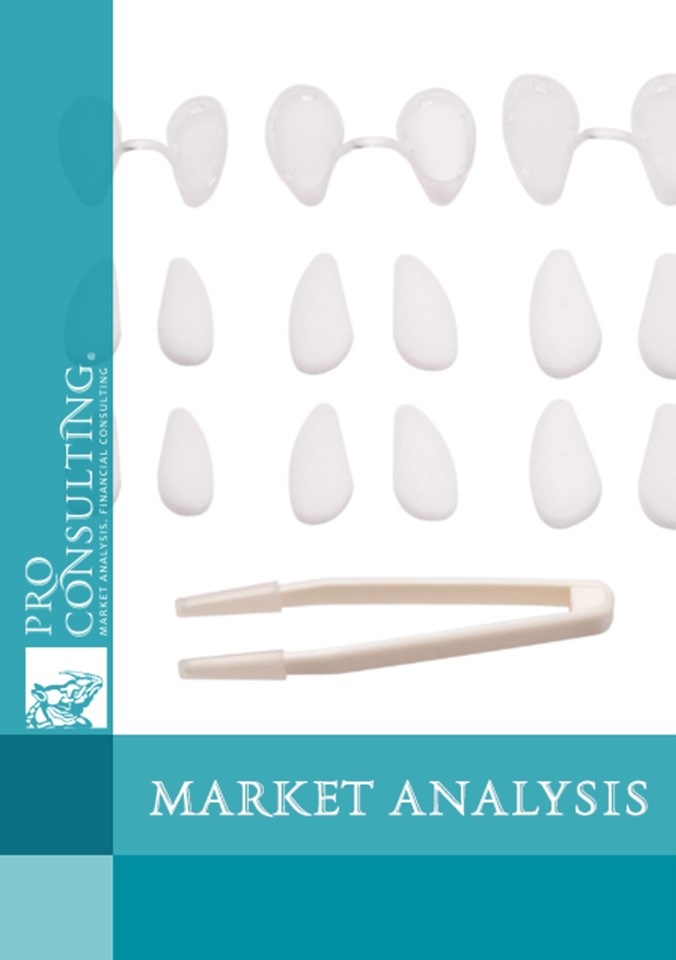
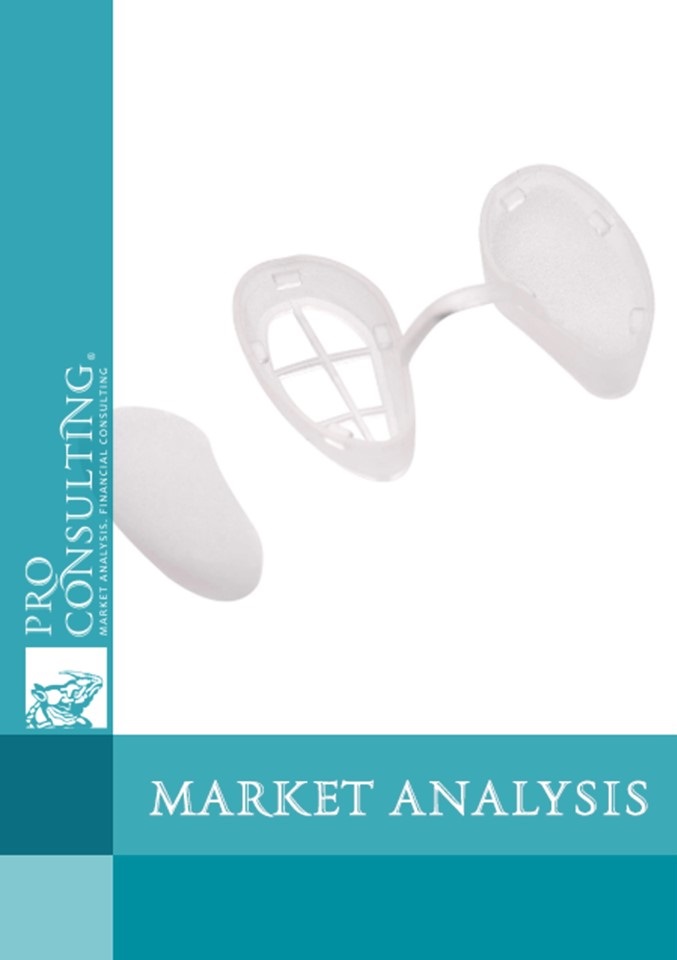
1.2. Analysis of the assortment policy on the market (which nasal filters you can buy)
1.3. Segmentation and structuring of the main market operators (by segments, groups, specializations and regions)
2. Calculation of the number of potential booster users in the USA
2.1. Dynamics of the number of people who regularly go in for sports, trends in the number of people suffering from respiratory diseases
2.2. Dynamics of the number of people suffering from respiratory diseases, trends
2.3. Market potential analysis based on potential audiences, forecasting the number of “potential” customers for 2017-2020, argumentation
3. Price and pricing in the US market
3.1. Current prices for nasal filters
3.2. Assessment of factors influencing price formation
4. Features of consumer preferences in the USA based on market offers (possible substitute goods, including medical products)
5. Conclusions and recommendations. Forecast indicators of market development in 2017-2020
List of Tables:
1. Dynamics of the share of Americans involved in sports in the United States as a whole, in 2001-2016 (in the context of five-year periods)
2. Dynamics of the proportion of Americans involved in sports in the US as a whole, 2001-2016 (annually)
3. The share of people involved in sports in the 10 largest US states in 2016,%
4. Dynamics of emissions of harmful particles into the atmosphere in the USA in 2003-2016, micrograms of particles per m3 of atmosphere
Fig. 5. Dynamics of emissions of harmful particles into the atmosphere in the 10 largest US states in 2016, micrograms of particles per m3 of atmosphere
6. Self-assessment of the level of health by US citizens in 2016, the number and proportion of people who assessed their health as unsatisfactory, million people
Fig. 7. Dynamics of the number of people with asthma in the USA as a whole in 2001-2016, million people
8. Number of people with asthma in the 10 largest US states, mln.
9. Proportion of people with COPD in the 10 largest US states in 2016, million people
Fig. 10. Structure of potential consumers of nasal filters and dilators in the USA as a whole in 2016, million people.
11. Forecast sales figures for the US nasal filter and dilator market as a whole in 2017-2020. in monetary terms, mln. USA
List of graphs and charts:
1. The main operators of the market of nasal dilators and filters in the USA and the world
2. Range of suppliers of nasal filters and dilators in the US and the world
3. Segmentation of nasal filters and dilators market operators.
4. Current and forecast number of consumers of nasal filters and dilators in the USA, million people.
5. Current filter prices of major nasal filter and dilator suppliers.