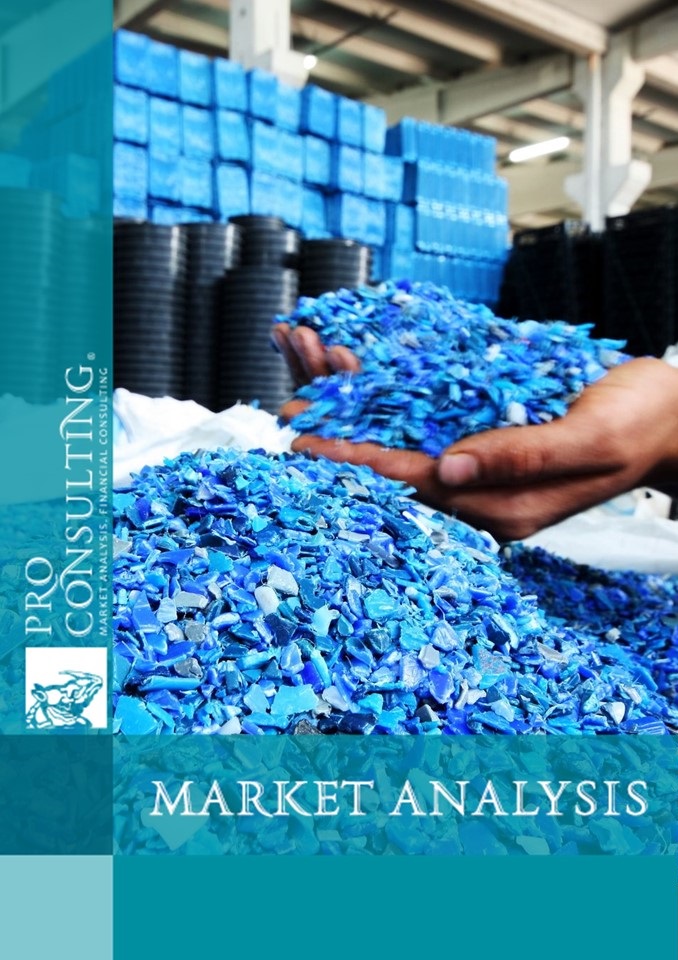
Market research report on secondary polymer in Ukraine. 2020 year
| Date of Preparation: | December 2020 year |
| Number of pages: | 40, Arial, 1 interval, 10 skittles |
| Graphs and charts: | 25 |
| Tables: | 15 |
| Payment method: | prepayment |
| Production method: | e-mail or courier electronically or in printed form |
| Report language: | ukrainian, russian, english |
- This report can be updated and customized based on your business goals; you can also purchase part of report (no less than 50%) at a more affordable price
- Failed to find your market research report? - contact us
- You can also order feasibility study and business plan for your business idea


Detailed contents:
1. General characteristics of the market
1.1. Analysis of market development trends (influence factors, prerequisites and development problems)
1.2. General market indicators, calculation of market capacity in 2017-6 months. 2020
- Analysis of the collection of garbage and waste in general
- The amount of waste generated from PE, PVC and PP
- The volume of recycled waste from the studied polymers
- The volume of production of secondary granules from the investigated polymers
1.3. Market segmentation and structuring (by type, origin, region)
1.4. Raw material base, production technology (analysis of advertisements for buying up and models for obtaining raw materials by processors)
2. State regulation of the market (basic laws and prospects for the polymer recycling market)
3. Production of secondary polymers in Ukraine in 2017-6 months. 2020 by type in quantitative terms
4. Main market operators (manufacturers and importers)
4.1. List of the main market operators and their description, in addition - the largest recyclers with the potential to enter the plastic recycling segment
4.2. Structuring of operators (by segments, specialization, capacity, regionally)
4.3. Market shares of the main operators (assessment based on financial statements, range and capacity of operators). General characteristics of the market
5. Foreign trade
5.1. Export of secondary polymers (granules and - according to the availability of data - waste for processing from Ukraine in 2017-6 months 2020 (volumes, structure, geography, shares of exporters)
5.2. Import of secondary polymers (granules and - according to the availability of data - waste for processing to Ukraine in 2017-6 months 2020 (volumes, structure, geography, shares of importers)
6. Price and market pricing
6.1. Average current prices for recycled pellets
6.2. Description of factors influencing price formation, structure
7. Consumers and their preferences. Industries that consume products made from recycled polymers
7.1. Analysis of the state and indicators of production of plastic products in Ukraine (which can accept secondary raw materials)
7.2. The largest manufacturers of plastic products in Ukraine (list and volumes)
8. Conclusions. Forecast indicators
8.1. Conclusions and Forecast Market Development Trends
8.2. Construction of market development hypotheses. Forecast indicators of market development in 2020-2023
8.3. Recommendations for development in the market
9. Investment attractiveness of the industry
9.1. SWOT analysis of the market direction
9.2. PESTLE-analysis of factors influencing the market
9.3. Existing risks and barriers to market entry. Building a risk map in the market
List of Tables:
1. Calculation of the market capacity of secondary polymers in 2017-1 half. 2020, in kind, thousand tons
2. Calculation of the market capacity of secondary polymers in 2017-1 half. 2020, in monetary terms, mln USD
3. Main operators of the market of secondary polymers
4. Manufacturers of plastic pipes with the prospect of creating a closed production cycle
5. Segmentation of the main market operators by the types of plastic they process
6. Segmentation of the main market operators by specialization
7. Segmentation of the main market operators by regions
8. Market shares of the main operators, in monetary terms, thousand US dollars, %
9. Exporters of secondary polymer granules in 2017-2019, in kind, tons, %
10. Importers of secondary polymer granules in 2017-2019, in kind, t, %
11. Largest plastic waste producers in 2020 by number of waste items
12. SWOT-analysis of the market of secondary polymers
13. PESTLE-analysis of the market of secondary polymers
14. Segmentation of market risks
15. Risk map of the market of secondary polymers in Ukraine
List of graphs and charts:
1. Dynamics of the market capacity of secondary polymers in 2017-1 2020, in kind, thousand tons
2. Dynamics of the market capacity of secondary polymers in 2017-1 2020, in monetary terms, mln USD
3. Dynamics of the number of facilities involved in waste processing in Ukraine in 2017-2019 as of the end of the year, units
4. Structure of plastic waste in 2019, in kind, t
5. Dynamics of generated waste from polyethylene (PET, HDPE, LDPE), polyvinyl chloride and polypropylene in 2017-2019, in kind, thousand tons
6. Dynamics of recycled waste from polyethylene (PET, HDPE, LDPE), polyvinyl chloride and polypropylene in 2017-2019, in kind, t
7. Dynamics of production of secondary granules in 2017-1st half. 2020, in kind, thousand tons
8. Segmentation of the market of secondary polymer granules by types among the studied segments, in natural terms, %
9. Segmentation of the market of secondary polymer granules by origin, in natural terms, %
10. Dynamics of the production of recycled granules from PE, PVC and PP in 2017-1 half. 2020, in kind, thousand tons
11. Dynamics of production of secondary granules in 2017-1 half. 2020, in monetary terms, mln USD
12. Segmentation of the main market operators by capacity, % of plastic processing by operators
13. Export volumes of secondary polymer granules in 2017-1 half. 2020, in kind, thousand tons
14. Export volumes of secondary polymer granules in 2017-1 half. 2020, in monetary terms, mln USD
15. Export structure of secondary polymer granules in 2017-2019, in kind, thousand tons
16. Export geography of secondary polymer granules in 2017-2019, in physical terms, tons
17. Dynamics of export of plastic waste in 2017-1 half. 2020, in kind, thousand tons
18. Volumes of imports of secondary polymer granules in 2017-1 half. 2020, in kind, thousand tons
19. Volumes of imports of secondary polymer granules in 2017-1 2020, in monetary terms, mln USD
20. Structure of imports of secondary polymer granules in 2017-1 2020, in kind, thousand tons
21. Geography of imports of secondary polymer granules in 2017-1 2020, in kind, t
22. The volume of imports of plastic waste for processing in 2017-1 2020, in kind, t
23. Cost structure of an enterprise producing secondary granules
24. Dynamics of the production of plastic products, which can accept secondary raw materials, in 2017-1 2020, in kind, thousand tons
25. Forecasted capacity of the secondary granule market in 2020-2023, in physical terms, thousand tons

