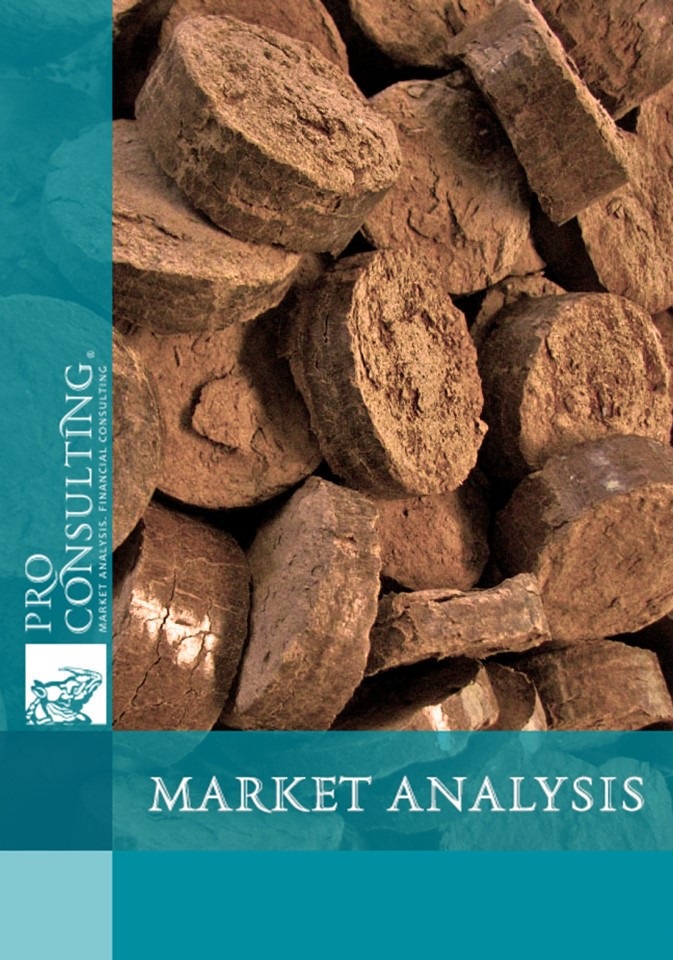
Market research report on fuel peat market in Ukraine. 2023 year
| Date of Preparation: | June 2023 year |
| Number of pages: | 34, Arial, 1 spacing, 10 pt |
| Graphs and charts: | 21 |
| Tables: | 13 |
| Payment method: | prepayment |
| Production method: | e-mail or courier electronically or in printed form |
| Report language: | ukrainian, russian, english |
- This report can be updated and customized based on your business goals; you can also purchase part of report (no less than 50%) at a more affordable price
- Failed to find your market research report? - contact us
- You can also order feasibility study and business plan for your business idea


Detailed contents:
1. General characteristics of the fuel peat market of Ukraine in comparison with other countries, 2019-2022.
1.1. Market description (areas of peat application, history, factors and problems of market development, assessment of market saturation level)
1.2. Analysis of current trends in the development of the fuel peat market
1.3. Main market indicators. Calculation of the capacity of the peat market in 2019-2022.
1.4. Segmentation and structuring of the market (by product origin (imported / domestic, by region, by assortment - fuel / other (agricultural / substrates))
2. Analysis of the influence of the state on the market
3. Volume of peat production in Ukraine in natural and monetary terms
3.1 Production volumes in 2019-2022 (thousand tons)
3.2 Production volumes in 2019-2022 (million UAH)
4. The main operators of the peat market in Ukraine
4.1 Analysis of the main operators of the fuel peat market and their description, structuring, features of sales policy and product promotion, assortment (main manufacturers, importers, exporters and distributors)
4.2 SWOT analysis of the TOP-5 operators of the fuel peat market
4.3 Shares of the main operators of the fuel peat market. Nature of competition and risks
5. Foreign trade
5.1 Export of products (volumes, structure, customs and invoice prices, geography of deliveries by country)
5.2 Import of fuel peat briquettes (volumes, structure, prices, geography of supplies by country)
6. Price and pricing on the fuel peat market
6.1 Dynamics of product prices by segment
6.2 Description of factors affecting price formation, structure
7. Market consumption
7.1 Consumer preferences of the studied products, consumer portrait (description of the target segment, consumer preferences regarding the choice of supplier and factors influencing the choice)
7.2 Analysis of the structure and consumption segments. Selection of promising niches (unsatisfied demand or satisfied due to imports)
8. Fuel peat sales channels (description and evaluation of the structure by direction)
9. Conclusions. Market development prospects. Forecast indicators of market development in 2023-2025. Recommendations based on research results.
10. Investment attractiveness of the industry
10.1 SWOT analysis of the market as a whole
10.2 Existing risks and barriers to market entry (including the appearance of new projects on the market)
List of Tables:
1. Deposits and reserves of peat in the regions of Ukraine as of 2020
2. Area of peat deposits in European countries, sq. km
3. Volume of peat extraction in European countries, sq. km
4. Dynamics of the fuel peat market capacity of Ukraine in 2019-2022 in natural terms, thousand tons
5. Dynamics of fuel peat market capacity in Ukraine in 2019-2022. in monetary terms, million UAH
6. Energy potential of peat in the regions of Ukraine
7. Necessary procedures for passing customs control during the export of peat
8. The main players of the fuel peat market
9. Segmentation of fuel peat market operators in terms of product sales channels
10. SWOT analysis of TOP-5 market operators
11. SWOT analysis of the peat market
12. Segmentation of market risks
13. Map of risks on the Ukrainian market
List of graphs and charts:
1. Regional structure of peat deposits in European countries, %
2. Structure of products by origin for 2022, %
3. Geographical structure of fuel peat production in Ukraine
4. Share of fuel and other types of peat on the market by production volumes in 2022, %
5. Dynamics of fuel peat production in Ukraine in 2019-2022. in natural terms, thousand tons
6. Dynamics of fuel peat production in Ukraine in 2019-2022. in monetary terms, million hryvnias.
7. Structure of the Ukrtorf Corporation and its constituent enterprises
8. Shares of fuel peat market operators in Ukraine by production volumes in 2022, in natural terms, %
9. Dynamics of fuel peat exports in 2019-2022, in natural terms, thousand tons
10. Dynamics of fuel peat exports in 2019-2022, in terms of value, UAH million.
11. Dynamics of average export prices for fuel peat in Ukraine in 2019-2022, UAH/ton
12. Geographical structure of peat exports in 2021, in natural terms, thousand tons, %
13. Dynamics of fuel peat imports in 2019-2022, in natural terms, thousand tons
14. Dynamics of fuel peat imports in 2019-2022, in monetary terms, million UAH.
15. Dynamics of average import prices for fuel peat in Ukraine in 2019-2022, UAH/ton
16. The structure of peat imports by import volume, January 2022, in natural terms, thousand tons, %
17. Dynamics of average retail prices for fuel peat in Ukraine in 2019-2022, UAH/ton
18. Structure of the cost price (on the example of the data of SE "Volyntorf", 2022), UAH, %
19. The structure of fuel peat sales by the main producers, 2022, %
20. The structure of fuel peat sales on the Ukrainian and European markets
21. Basic forecast of the development of peat extraction in Ukraine in 2023-2025 in natural
