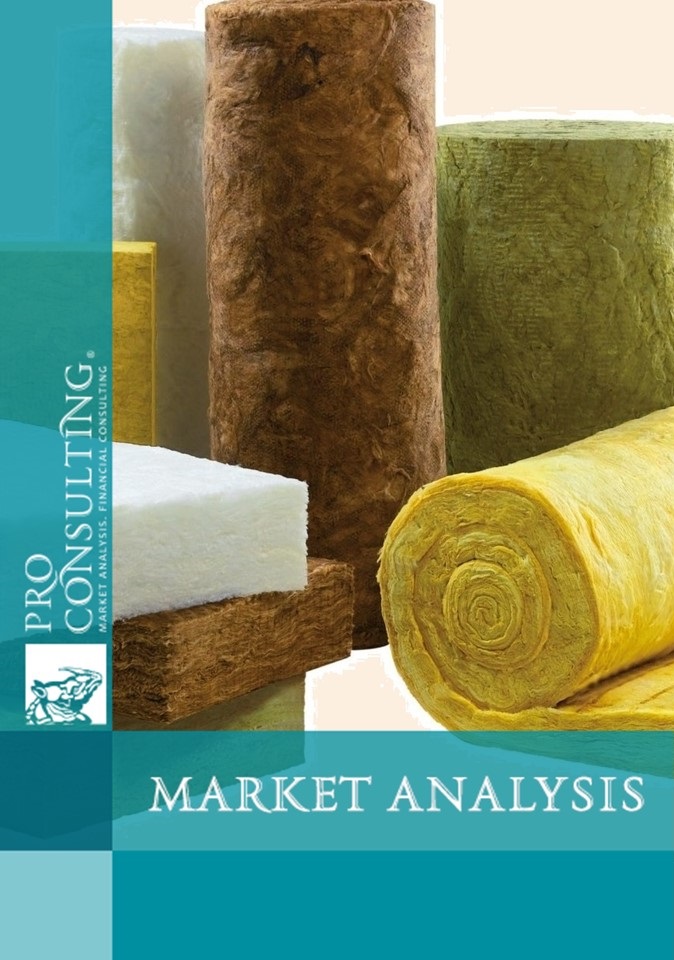
Analysis of the thermal insulation materials market in Ukraine. 2024

| Date of Preparation: | November 2024 year |
| Number of pages: | 28, Arial, 1 interval, 10 skittles |
| Graphs and charts: | 13 |
| Tables: | 27 |
| Payment method: | prepayment |
| Production method: | e-mail or courier electronically or in printed form |
| Report language: | ukrainian, russian, english |
- This report can be updated and customized based on your business goals; you can also purchase part of report (no less than 50%) at a more affordable price
- Failed to find your market research report? - contact us
- You can also order feasibility study and business plan for your business idea


Detailed contents:
1. General characteristics of the heat-insulating materials market in Ukraine
1.1. Analysis of trends in the development of the TIM market in Ukraine in 2019-2023 (trends, features, problems, factors affecting the market, including trends in the construction market)
1.2. General market indicators, calculation of the capacity of the TIM market by segment in physical and monetary terms (UAH, USD) for 2019-2023 - estimated
1.3. Segmentation and structuring of the heat-insulating materials market 5
2. Taxes and fees on the TIM market in Ukraine
3. Production on the market of heat-insulating materials in Ukraine
3.1. Volume of production in quantitative indicators
3.2. Production volume in value indicators
4. The main operators of the heat-insulating materials market in Ukraine
4.1. The list of the main manufacturers of the heat-insulating materials market, their brief characteristics
4.2. Structuring of operators of thermal insulation materials by segments and regions
4.3. Market shares of the main operators of the heat-insulating materials market in Ukraine
5. Foreign trade in the market of thermal insulation materials in Ukraine
5.1. Exports in 2019-2023... by segments (volumes, structure, average export prices, geography of supplies by country, exporting companies and their shares in the structure of supplies)
5.2. Imports in 2019-2023, divided into 3 segments (volumes, structure, average import prices, geography of supplies by country, importing companies and their shares in the structure of supplies)
6. Price and pricing on the market of heat-insulating materials in Ukraine
6.1. Current average wholesale or retail prices for thermal insulation materials
6.2. Description of factors affecting the formation of the price of heat-insulating materials, structure
7. Consumers in the market of heat-insulating materials in Ukraine, as one of the sales channels
7.1. Spheres of TIM consumption in Ukraine. Evaluation of shares of spheres in the structure of consumption. Product preferences are general characteristics of quality products
7.2. TOP-10 companies according to financial indicators among potential consumers of products. Existing additional product sales channels
8. Conclusions. Forecast indicators on the market of thermal insulation materials in Ukraine
8.1. Conclusions and forecast trends in the development of the heat-insulating materials market in Ukraine until 2024-2028.
8.2. Construction of market development hypotheses. Forecast indicators of the development of the market of thermal insulation materials in 2024-2028, taking into account influencing factors
List of Tables:
1. Indicators of the market capacity of thermal insulation materials in Ukraine in 2019 - 1 half. 2024 in natural terms, thousand tons, and worth million hryvnias, million dollars. USA
2. The structure of the heat-insulating materials market in Ukraine in 2019 - 1st half. 2024 in terms of value, million hryvnias.
3. The share of imports and domestic production in the market of thermal insulation materials in Ukraine in 2019 - 1 half. 2024 in value terms, UAH, %
4. Production of thermal insulation materials in Ukraine in 2019 - 1 half. 2024 in natural terms, thousand tons
5. Production of thermal insulation materials in Ukraine in 2019 - 1 half. 2024 in value terms, million hryvnias
6. Production of thermal insulation materials in Ukraine in 2019 - 1 half. 2024 in value terms, million US dollars
7. The structure of the regional distribution of the main operators of the heat-insulating materials market in Ukraine*
8. Shares of thermal insulation materials market operators from Ukraine in 2023. in value terms, mln. UAH, %
9. Dynamics of export of basalt wool from Ukraine in 2019 - 1 half. 2024 in natural and value terms, thousand tons, million UAH, million dollars USA
10. Shares of basalt wool exporters from Ukraine in 2023 - 1 half. 2024 in value terms, mln. UAH, %
11. Average export prices of basalt wool in 1 half. 2024, UAH per 1 kg of products, without VAT
12. Dynamics of foam export from Ukraine in 2019 - 1 half. 2024 in physical and value terms, thousand tons, million UAH, million dollars USA
13. Shares of foam exporters from Ukraine in 2023 - 1 half. 2024 in value terms, million hryvnias.
14. Average export prices of foam plastics in 1 half. 2024, UAH per 1 kg of products, without VAT
15. Dynamics of basalt wool import to Ukraine in 2019 - 1 half. 2024 in natural and value terms, thousand tons, million UAH, million dollars USA
16. Shares of basalt wool importers in Ukraine in 2023 - 1 half. 2024 in value terms, million hryvnias
17. Average prices for imported basalt wool in 1 half. 2024, UAH per 1 kg of products, without VAT
18. Dynamics of Styrofoam imports to Ukraine in 2019 - 1st half. 2024 in physical and value terms, thousand tons, million UAH, million dollars USA
19. Average import prices of foam plastics in 1 half. 2024, UAH per 1 kg of products, without VAT
20. Shares of foam importers in Ukraine in 2023 - 1 half. 2024 in value terms, million hryvnias
21. Dynamics of glass wool imports to Ukraine in 2019 - 1st half. 2024 in natural and value terms, thousand tons, million UAH, million dollars USA
22. Shares of glass importers to Ukraine in 2023-1 half 2024 in value terms, million hryvnias
23. Average export prices of glass in 1 half. 2024, UAH per 1 kg of products, without VAT
24. Table of average retail prices of the main manufacturers and importers for heat-insulating materials as of October 2024, UAH/kg, including VAT
25. General characteristics of the quality of heat-insulating materials and their analogues, which consumers pay attention to
26. List of potential consumer companies, according to financial statements, UAH million.
27. Forecast indicators of the market capacity of thermal insulation materials in Ukraine in 2024-2028, million UAH.
List of graphs and charts:
1. Market structure of basalt wool by brand in Ukraine in 2023, in value terms, %
2. Structure of the foam plastic market by brand in Ukraine in 2023, in value terms, %
3. The structure of the glass wool market by brand in Ukraine in 2023, in terms of value, %
4. Structure of basalt wool market operators in Ukraine as of 2023. in value terms, %
5. Structure of operators of the foam plastic and polystyrene foam market in Ukraine as of 2023. in value terms, %
6. The structure of glass wool market operators in Ukraine as of 2023. in value terms, %
7. Geography of export of basalt cotton wool from Ukraine in 2023-1 2024 in value terms, UAH, %
8. Geography of foam plastic exports from Ukraine in 2023-1 pol. 2024 in value terms, %
9. Geography of basalt cotton wool imports to Ukraine in 2023-1 2024 in value terms, UAH, %
10. Geography of Styrofoam imports to Ukraine in 2023 - 1 st. 2024 in value terms, %
11. Geography of glass wool imports to Ukraine in 2023 - 1 half. 2024 in value terms, UAH, %
12. Cost structure of production of thermal insulation materials in Ukraine, in monetary terms, %
13. The structure of consumption of thermal insulation materials in Ukraine, in monetary terms, %
