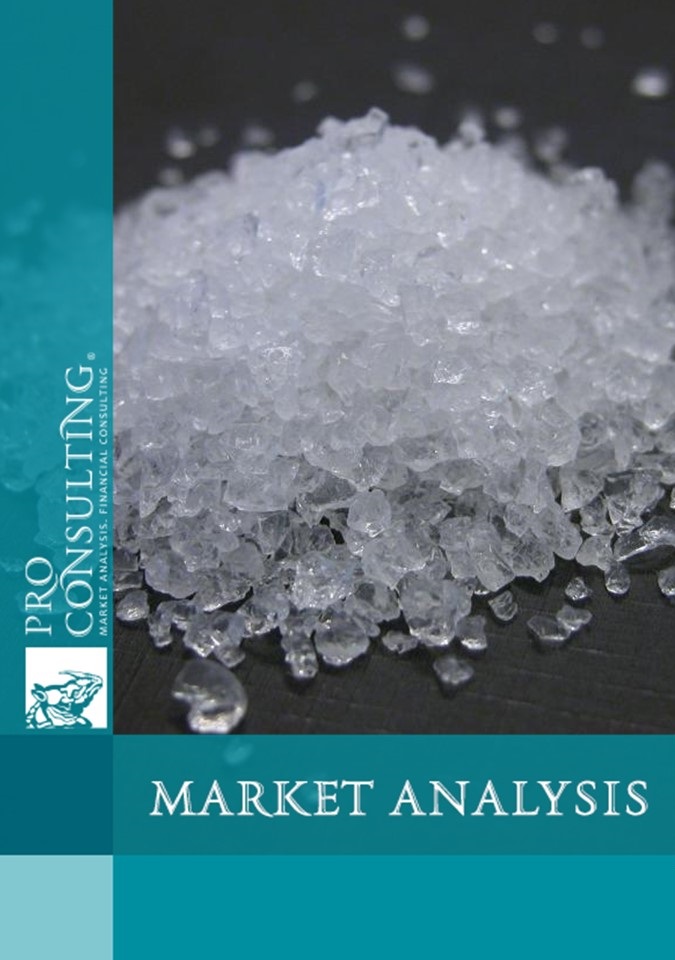
Analysis of the Pyrogenic silicon dioxide market in Ukraine. 2019
| Date of Preparation: | August 2019 year |
| Number of pages: | 48, Arial, 1 interval, 10 pt |
| Graphs and charts: | 30 |
| Tables: | 24 |
| Payment method: | prepayment |
| Production method: | e-mail or courier electronically or in printed form |
| Report language: | russian |
- This report can be updated and customized based on your business goals; you can also purchase part of report (no less than 50%) at a more affordable price
- Failed to find your market research report? - contact us
- You can also order feasibility study and business plan for your business idea


Detailed contents:
1. General characteristics of the pyrogenic silicon dioxide market in Ukraine in 2018-6 months 2019
1.1. Analysis of trends in the development of pyrogenic silicon dioxide in Ukraine in 2018-6 months 2019 (Specificity and problems of the market, influence factors on the market)
1.2. Overall market indicators, calculation of the pyrogenic silicon dioxide market capacity in Ukraine in 2018-6 months 2019 - estimation on the basis of production data and FEA in kind and monetary terms
1.3. Segmentation and Structuring of the Pyrogenic Silicon Dioxide Market in Ukraine:
- By origin (in market capacity structure):
• share of domestic pyrogenic silicon dioxide;
• share of imported pyrogenic silicon dioxide.
- By fields of application (in the structure of imports):
• Pharmaceuticals;
• varnishes;
• paints;
• metals;
• others - if information available.
2. Production of pyrogenic silicon dioxide in Ukraine in 2018-6 months 2019
2.1. Production volume of pyrogenic silicon dioxide in Ukraine in 2018-6 months 2019 in quantitative terms
2.2. Production volume of pyrogenic silicon dioxide in Ukraine in 2018-6 months 2019 in value terms
3. Major producers of the pyrogenic silicon dioxide market in Ukraine
3.1. List and summary of the major manufacturers of Pyrogenic Silicon Dioxide Market in Ukraine
3.2. Structuring of operators (by segments, regionally; definition of companies-operators' additional sphere of activity)
3.3. Major market players shares in the structure of pyrogenic silicon dioxide production in Ukraine
4. Foreign trade in the pyrogenic silicon dioxide market in Ukraine in 2018-6 months 2019
4.1. Pyrogenic silicon dioxide Export from Ukraine in 2018-6 months 2019 (Volume, structure, average export prices, geography of deliveries by countries, major exporters and their shares in the overall structure of exports; major companies purchasing pyrogenic silicon dioxide in Ukraine)
4.2. Pyrogenic silicon dioxide Import into Ukraine in 2018-6 months 2019 (Volumes, average import prices, geography of deliveries by countries, major importers and their shares in the overall structure of imports; companies sending pyrogenic silicon dioxide to Ukraine)
5. Price and pricing in the pyrogenic silicon dioxide market in Ukraine
5.1. Current average wholesale prices, based on public data
5.2. Description of factors affecting the pricing of pyrogenic silicon dioxide in Ukraine, depending on the type of products (A175, А200, etc.)
6. Consumers in the pyrogenic silicon dioxide market in Ukraine and their advantages
6.1. Areas of Application: Top 5 Consumer Companies, Depending on Scope: Operators List, Short Description, Product assortment where Pyrogenic Silicon Dioxide used
6.2. Consumption in the B2G sector. Analysis of state public tenders (volumes, structure by regions, organizers and participants) - if data available
7. Existing additional channels of sale in the pyrogenic silicon dioxide market in Ukraine - description only, without companies selection
8. Conclusions. Forecast indicators of pyrogenic silicon dioxide in Ukraine in 2019-2021
8.1. Conclusions and Forecast Trends in Market Development of Pyrogenic Silicon Dioxide in Ukraine
8.2. Construction of market development hypotheses. Forecast of pyrogenic silicon dioxide market development indicators in Ukraine in 2019-2021
8.3. Recommendations for the development of pyrogenic silicon dioxide in Ukraine
9. Investment attractiveness of the industry
9.1. SWOT-analysis of the pyrogenic silicon dioxide market in Ukraine
9.2. PEST analysis of the factors influencing the pyrogenic silicon dioxide market in Ukraine
List of Tables:
1. The reserves of the Yeristov deposit of ferrous quartzites on the JORC resource assessment system as of 01.01.2019, million tons
2. Dynamics of Pyrogenic Silicon Dioxide Capacity Market Indicators in 2018-6 months 2019 in Ukraine, in kind, thousand tons
3. Dynamics of the pyrogenic silicon dioxide market capacity indexes in 2018-6 months 2019, in monetary terms, mln.UAH
4. Producers of pyrogenic silicon dioxide in Ukraine
5. Structuring of pyrogenic silicon dioxide market operators in Ukraine in terms of products in assortment
6. Structuring of Pyrogenic Silicon Dioxide Market Operators in Ukraine in terms of products Application Scopes in Assortment
7. Pyrogenic silicon dioxide market operators in Ukraine in terms of types of activity of the company
8. Average export value of Ukrainian pyrogenic silicon dioxide by exported brands in 2018, UAH / kg
9. Major pyrogenic silicon dioxide exporters in Ukraine in 2018-6 months 2019, in kind and monetary terms, thousand tons and millions of UAH.
10. Major pyrogenic silicon dioxide importers of Ukrainian production in 2018, in kind and monetary terms, thousand tons and millions of UAH.
11. Average import value of pyrogenic silicon dioxide in Ukraine in 2018, UAH / kg
12. Major pyrogenic silicon dioxide importers in Ukraine in 2018-6 months 2019, in kind and monetary terms, thousand tons and millions of UAH.
13. Major suppliers of pyrogenic silicon dioxide to the territory of Ukraine in 2018, in kind and monetary terms, thousand tons and millions of UAH.
14. Average import value of pyrogenic silicon dioxide in Ukraine in 2018 by imported products TMs, UAH / kg
15. Current average wholesale prices for pyrogenic silicon dioxide, depending on the type of product
16. Factors influencing the cost of pyrogenic silicon dioxide
17. TOP-5 companies-consumers of pyrogenic silicon dioxide in Ukraine in the drug production sphere
18. TOP-5 Consumers of Pyrogenic Silicon Dioxide in Ukraine in the Rubber mixtures and its Products manufacture
19. Top 5 Consumers of Pyrogenic Silicon Dioxide in the Cosmetics and Perfumery Industry
20. Top 5 companies-consumers of pyrogenic silicon dioxide in the field of paint and lacquers products production
21. Examples of government tender procurement of pyrogenic silicon dioxide in Ukraine
22. Advantages and disadvantages of direct and indirect sales of pyrogenic silicon dioxide in the Ukrainian market
23. SWOT-analysis of the pyrogenic silicon dioxide market in Ukraine
24. PEST-analysis of the pyrogenic silicon dioxide market in Ukraine
List of graphs and charts:
1. Dynamics of paint and lacquers products manufacture in Ukraine in 2011-2018, in kind, thousand tons
2. Dynamics of cosmetic products and soap manufacture in Ukraine in 2011-2018, in kind, thousand tons
3. Dynamics of drug production in Ukraine in 2011-2018, in kind, thousand tons
4. Dynamics of production of rubber and its products (tires, hoses, etc.) in Ukraine in 2011-2018, in kind, thousand tons
5. Dynamics of food production (excluding alcoholic and non-alcoholic beverages) in Ukraine in 2011-2018, in kind, thousand tons
6. Dynamics of beer production (alcoholic and nonalcoholic) in Ukraine in 2011-2018, in kind, mln.
7. Dynamics of the producer price index and the consumer price index in Ukraine in 2010-2018,%
8. Dynamics of the capacity of the pyrogenic silicon dioxide market in 2018-6 months 2019, in kind, thousand tons
9. Dynamics of the pyrogenic silicon dioxide market indexes capacity in 2018-6 months 2019, in monetary terms, mln. UAH
10. Structure of the pyrogenic silicon dioxide market in Ukraine in terms of origin of production in 2018-6 months 2019, in kind,%
11. Structure of pyrogenic silicon dioxide imports into the territory of Ukraine in 2018 by types of imported products, in kind,%
12. Dynamics of pyrogenic silicon dioxide production in Ukraine in 2018-6 months 2019, in kind, thousand tons
13. Dynamics of pyrogenic silicon dioxide implementation in Ukraine in 2018-6 months 2019, in kind, thousand tons
14. Dynamics of pyrogenic silicon dioxide implementation in Ukraine in 2018-6 months 2019, in monetary terms, mln.UAH
15. Dynamics of pyrogenic silicon dioxide producers average prices in Ukraine in 2018-6 months 2019, UAH / kg.
16. Geographical structuring of the pyrogenic silicon dioxide market operators in Ukraine
17. Major market players Shares in structure of pyrogenic silicon dioxide production in Ukraine in 2018, in kind,%
18. Major market players Shares in structure of pyrogenic silicon dioxide production in Ukraine in 2018, in monetary expression,%
19. Dynamics of pyrogenic silicon dioxide exports from Ukraine in 2018-6 months 2019, in kind, thousand tons
20. Dynamics of pyrogenic silicon dioxide exports from Ukraine in 2018-6 months 2019, in monetary terms, ths.UAH
21. Dynamics of pyrogenic silicon dioxide average export prices of Ukrainian production in 2018-6 months 2019, UAH / kg.
22. Export Structure of Ukrainian Pyrogenic Silicon Dioxide by Exported TMs in 2018,%
23. Geographical structure of pyrogenic silicon dioxide exports from Ukraine in 2018-6 months 2019, in kind,%
24. Structure of pyrogenic silicon dioxide exports from Ukraine in 2018 by destination of exported products, in kind,%
25. Dynamics of pyrogenic silicon dioxide imports into the territory of Ukraine in 2018-6 months 2019, in kind, thousand tons
26. Dynamics of pyrogenic silicon dioxide imports into the territory of Ukraine in 2018-6 months 2019, in monetary terms, ths.UAH
27. Dynamics of average import prices for pyrogenic silicon dioxide into the territory of Ukraine in 2018-6 months 2019, UAH / kg.
28. Geographical structure of pyrogenic silicon dioxide imports into the territory of Ukraine in 2018-6 months 2019, in kind,%
29. Structure of pyrogenic silicon dioxide imports into the territory of Ukraine in 2018 by trade marks, in kind,%
30. Forecast of the pyrogenic silicon dioxide market capacity in Ukraine on the basis of multifactorial model, in kind, thousand tons
