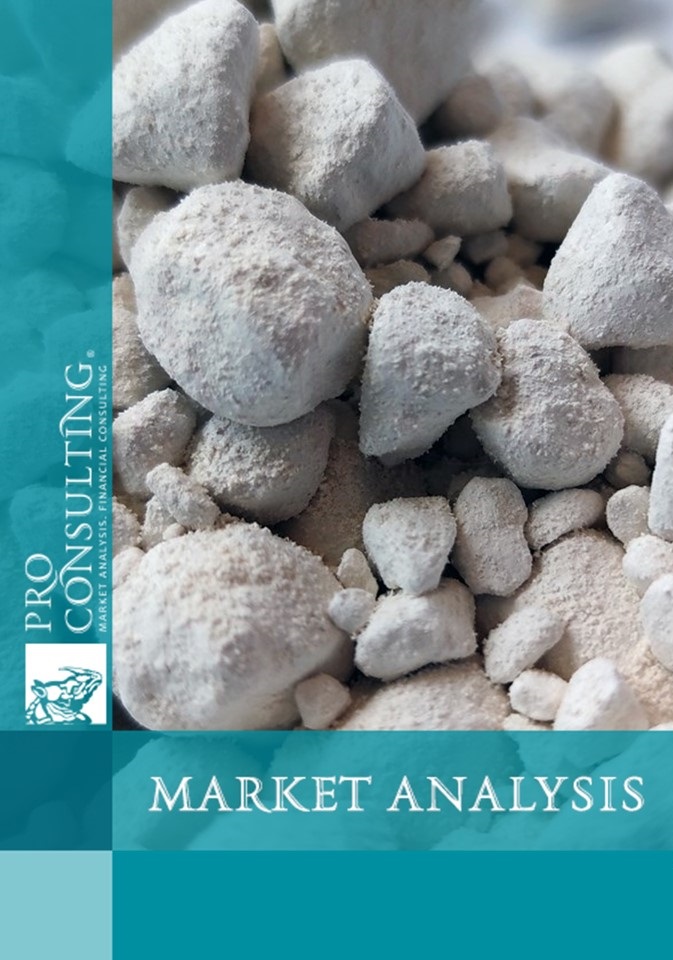
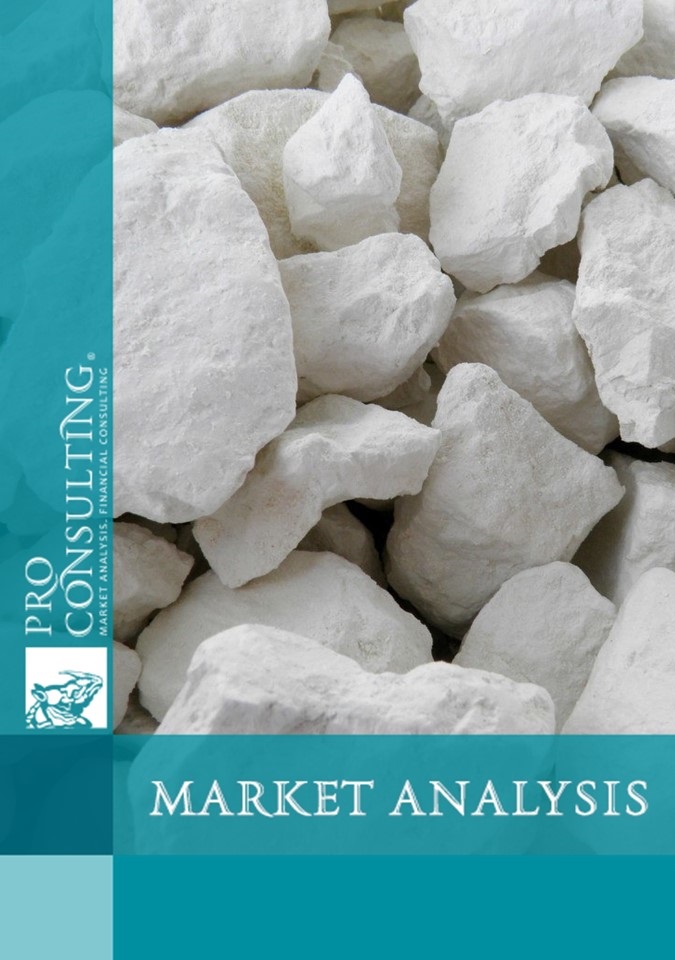
Analysis of the kaolin market in Ukraine and the world. 2021 year
| Date of Preparation: | January 2021 year |
| Number of pages: | 30, Arial, 1 interval, 10 pt |
| Graphs and charts: | 12 |
| Tables: | 10 |
| Payment method: | prepayment |
| Production method: | e-mail or courier electronically or in printed form |
| Report language: | ukrainian, russian, english |
- This report can be updated and customized based on your business goals; you can also purchase part of report (no less than 50%) at a more affordable price
- Failed to find your market research report? - contact us
- You can also order feasibility study and business plan for your business idea


Detailed contents:
1. Analysis of trends in the global kaolin market (trends in extraction, use in industry) - highlighting the Ukrainian market
2. General market indicators. Production volume in Ukraine and the largest countries in 2016-2020
3. Market shares of the main operators (in Ukraine and in the world as a whole)
4. Foreign trade in the Ukrainian market
4.1. Import of products in 2016-2020 (volume, dynamics)
4.2. Export of products in 2016-2020 (volumes, dynamics, geography, structure by exporters)
5. Price and pricing in the market
5.1. Export prices by exporting countries around the world
6. Conclusions and recommendations
6.1. Conclusions and forecast indicators of the development of the kaolin market in Ukraine and the world
6.2. Recommendations for entering the market (the feasibility of working in the market)
6.3. Calculation of the prospects for launching a project for the extraction and enrichment of kaolin (profitability of companies that operate on the market)
List of Tables:
1. The main areas of clay use in industry
2. Kaolin mines of Ukraine
3. Large kaolin quarries of Ukraine
4. The main countries producing kaolin in 2016-2020, (thousand tons)
5. Distribution of kaolin reserves by administrative regions (according to the results of 2020) in volume terms, thousand tons
6. The main operators of the global kaolin market
7. The main kaolin mining companies in Ukraine (according to the results of 2020)
8. Extraction and realization of kaolin in the section of quarries
9. The average price of kaolin in 2019 among exporting countries, USD USA for 1 kg
10. Financial indicators of the main operators of the kaolin market in 2019 in Ukraine
List of graphs and charts:
1. Segmentation and structuring of the kaolin market by application areas in 2020,%
2. Volume of kaolin production in Ukraine in 2011-2019, thousand tons
3. Demand for kaolin in the world in volume terms,%
4. Dynamics of commissioning of residential real estate objects in Ukraine for 2016-2019, mln. M²
5. Dynamics of refractories production in 2016-2019, in volume terms
6. Dynamics of production in the field of paper industry in 2016-2019, in volume terms
7. Distribution of kaolin reserves in Ukraine (according to the results of 2020) in volume terms, thousand tons
8. Estimation of the market share of the main global manufacturers (2018),%
9. Dynamics of import of kaolin to Ukraine in 2016-2020 in volume terms, thousand tons
10. Dynamics of kaolin export to Ukraine in 2016 - 2020 in volume terms, thousand tons
11. The structure of kaolin exports from Ukraine in 2016-2020 by recipient countries in volume terms,%
12. The structure of kaolin exports from Ukraine in 2016-2020 by exporting companies in volume terms,%
